Toyota 2015 Annual Report Download - page 113
Download and view the complete annual report
Please find page 113 of the 2015 Toyota annual report below. You can navigate through the pages in the report by either clicking on the pages listed below, or by using the keyword search tool below to find specific information within the annual report.-
 1
1 -
2
-
3
-
4
-
5
-
6
-
7
-
8
-
9
-
10
-
11
-
12
-
13
-
14
-
15
-
16
-
17
-
18
-
19
-
20
-
21
-
22
-
23
-
24
-
25
-
26
-
27
-
28
-
29
-
30
-
31
-
32
-
33
-
34
-
35
-
36
-
37
-
38
-
39
-
40
-
41
-
42
-
43
-
44
-
45
-
46
-
47
-
48
-
49
-
50
-
51
-
52
-
53
-
54
-
55
-
56
-
57
-
58
-
59
-
60
-
61
-
62
-
63
-
64
-
65
-
66
-
67
-
68
-
69
-
70
-
71
-
72
-
73
-
74
-
75
-
76
-
77
-
78
-
79
-
80
-
81
-
82
-
83
-
84
-
85
-
86
-
87
-
88
-
89
-
90
-
91
-
92
-
93
-
94
-
95
-
96
-
97
-
98
-
99
-
100
-
101
-
102
-
 103
103 -
 104
104 -
 105
105 -
 106
106 -
 107
107 -
 108
108 -
 109
109 -
 110
110 -
 111
111 -
 112
112 -
 113
113 -
 114
114 -
 115
115 -
 116
116 -
 117
117 -
 118
118 -
 119
119 -
 120
120 -
 121
121 -
 122
122 -
 123
123 -
124
-
125
-
126
-
127
-
128
-
129
-
130
-
131
-
132
-
133
-
134
-
135
-
136
-
137
-
138
-
139
-
140
-
141
-
142
-
143
-
144
-
145
-
146
-
147
-
148
-
149
-
150
-
151
-
152
-
153
-
154
-
155
-
156
-
157
-
158
-
159
-
160
-
161
-
162
-
163
-
164
-
165
-
166
-
167
-
168
-
169
-
170
-
171
-
172
-
173
-
174
-
175
-
176
-
177
-
178
-
179
-
180
-
181
-
182
-
183
-
184
-
185
-
186
-
187
-
188
-
189
-
190
-
191
-
192
-
193
-
194
-
195
-
196
-
197
-
198
-
199
-
200
-
201
-
202
-
203
-
204
-
205
-
206
-
207
-
208
-
209
-
210
-
211
-
212
-
213
-
214
-
215
-
216
-
217
-
218
-
219
-
220
-
221
-
222
-
223
-
224
-
225
-
226
-
227
-
228
 |
 |

5. Not applicable.
6. Export Sales. See “Operating and Financial Review and Prospects — Operating Results — Overview —
Geographic Breakdown.”
7. Legal and Arbitration Proceedings. See “Information on the Company — Business Overview — Legal
Proceedings.”
8. Dividend Policy. See “Key Information — Selected Financial Data — Dividend Information.”
8.B SIGNIFICANT CHANGES
Except as disclosed in this annual report, there have been no significant changes since the date of Toyota’s
latest annual financial statements.
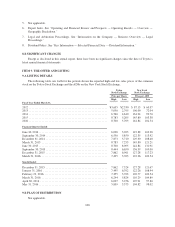
ITEM 9. THE OFFER AND LISTING
9.A LISTING DETAILS
The following table sets forth for the periods shown the reported high and low sales prices of the common
stock on the Tokyo Stock Exchange and the ADSs on the New York Stock Exchange.
Tokyo
Stock Exchange
New York
Stock Exchange
Price per Share Price per ADS
High Low High Low
Fiscal Year Ended March 31,
2012 ....................................................... ¥3,635 ¥2,330 $ 87.15 $ 60.37
2013 ....................................................... 5,050 2,795 106.00 72.04
2014 ....................................................... 6,760 4,610 134.94 99.70
2015 ....................................................... 8,783 5,205 145.80 103.38
2016 ....................................................... 8,700 5,703 142.84 102.54
Financial Quarter Ended:
June 30, 2014 ................................................ 6,090 5,205 119.88 103.38
September 30, 2014 ........................................... 6,550 5,850 122.35 113.92
December 31, 2014 ........................................... 7,873 5,710 129.30 108.40
March 31, 2015 .............................................. 8,783 7,255 145.80 121.21
June 30, 2015 ................................................ 8,700 8,095 142.84 131.91
September 30, 2015 ........................................... 8,444 6,650 136.39 105.00
December 31, 2015 ........................................... 7,862 6,961 127.28 117.23
March 31, 2016 .............................................. 7,495 5,703 122.26 102.54
Month Ended:
December 31, 2015 ........................................... 7,862 7,324 127.28 121.67
January 31, 2016 ............................................. 7,495 6,392 122.26 108.94
February 29, 2016 ............................................ 7,355 5,703 120.77 102.54
March 31, 2016 .............................................. 6,244 5,824 110.29 104.89
April 30, 2016 ............................................... 6,027 5,256 107.91 97.80
May 31, 2016 ................................................ 5,839 5,375 104.82 98.02
9.B PLAN OF DISTRIBUTION
Not applicable.
108