Toyota 2015 Annual Report Download - page 59
Download and view the complete annual report
Please find page 59 of the 2015 Toyota annual report below. You can navigate through the pages in the report by either clicking on the pages listed below, or by using the keyword search tool below to find specific information within the annual report.-
 1
1 -
2
-
3
-
4
-
5
-
6
-
7
-
8
-
9
-
10
-
11
-
12
-
13
-
14
-
15
-
16
-
17
-
18
-
19
-
20
-
21
-
22
-
23
-
24
-
25
-
26
-
27
-
28
-
29
-
30
-
31
-
32
-
33
-
34
-
35
-
36
-
37
-
38
-
39
-
40
-
41
-
42
-
43
-
44
-
45
-
46
-
47
-
48
-
 49
49 -
 50
50 -
 51
51 -
 52
52 -
 53
53 -
 54
54 -
 55
55 -
 56
56 -
 57
57 -
 58
58 -
 59
59 -
 60
60 -
 61
61 -
 62
62 -
 63
63 -
 64
64 -
 65
65 -
 66
66 -
 67
67 -
 68
68 -
 69
69 -
70
-
71
-
72
-
73
-
74
-
75
-
76
-
77
-
78
-
79
-
80
-
81
-
82
-
83
-
84
-
85
-
86
-
87
-
88
-
89
-
90
-
91
-
92
-
93
-
94
-
95
-
96
-
97
-
98
-
99
-
100
-
101
-
102
-
103
-
104
-
105
-
106
-
107
-
108
-
109
-
110
-
111
-
112
-
113
-
114
-
115
-
116
-
117
-
118
-
119
-
120
-
121
-
122
-
123
-
124
-
125
-
126
-
127
-
128
-
129
-
130
-
131
-
132
-
133
-
134
-
135
-
136
-
137
-
138
-
139
-
140
-
141
-
142
-
143
-
144
-
145
-
146
-
147
-
148
-
149
-
150
-
151
-
152
-
153
-
154
-
155
-
156
-
157
-
158
-
159
-
160
-
161
-
162
-
163
-
164
-
165
-
166
-
167
-
168
-
169
-
170
-
171
-
172
-
173
-
174
-
175
-
176
-
177
-
178
-
179
-
180
-
181
-
182
-
183
-
184
-
185
-
186
-
187
-
188
-
189
-
190
-
191
-
192
-
193
-
194
-
195
-
196
-
197
-
198
-
199
-
200
-
201
-
202
-
203
-
204
-
205
-
206
-
207
-
208
-
209
-
210
-
211
-
212
-
213
-
214
-
215
-
216
-
217
-
218
-
219
-
220
-
221
-
222
-
223
-
224
-
225
-
226
-
227
-
228
 |
 |
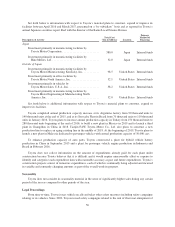
Toyota is constantly engaged in upgrading, modernizing and revamping the operations of its manufacturing
facilities based on its assessment of market needs and prospects. To respond flexibly to fluctuations in demand in
each of its production operations throughout the world, Toyota continually reviews and implements appropriate
production measures such as revising takt time and adjusting days of operation. As a result, Toyota believes it
would require unreasonable effort to track the exact productive capacity and the extent of utilization of each of its
manufacturing facilities with a reasonable degree of accuracy.
As of March 31, 2016, property, plant and equipment having a net book value of approximately
¥335.3 billion was pledged as collateral securing indebtedness incurred by Toyota Motor Corporation’s
consolidated subsidiaries. Toyota believes that there does not exist any material environmental issues that may
affect the company’s utilization of its assets.
Toyota considers all its principal manufacturing facilities and other significant properties to be in good
condition and adequate to meet the needs of its operations.
See “— Business Overview — Capital Expenditures and Divestitures” for a description of Toyota’s material
plans to construct, expand or improve facilities.
ITEM 4A. UNRESOLVED STAFF COMMENTS
None.
ITEM 5. OPERATING AND FINANCIAL REVIEW AND PROSPECTS
5.A OPERATING RESULTS
Financial information discussed in this section is derived from Toyota’s consolidated financial statements
that appear elsewhere in this annual report. The financial statements have been prepared in conformity with
accounting principles generally accepted in the United States of America.
Overview
The business segments of Toyota include automotive operations, financial services operations and all other
operations. Automotive operations are Toyota’s most significant business segment, accounting for 89% of
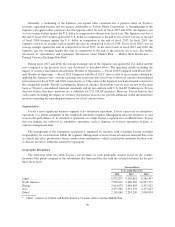
Toyota’s total revenues before the elimination of intersegment revenues for fiscal 2016. Toyota’s primary
markets based on vehicle unit sales for fiscal 2016 were: Japan (24%), North America (33%), Europe (10%) and
Asia (15%).
Automotive Market Environment
The worldwide automotive market is highly competitive and volatile. The demand for automobiles is
affected by a number of factors including social, political and general economic conditions; introduction of new
vehicles and technologies; and costs incurred by customers to purchase or operate vehicles. These factors can
cause consumer demand to vary substantially in different geographic markets and for different types of
automobiles.
During fiscal 2016, although markets have progressed in a steady manner, especially in the U.S., markets in
some emerging countries have become stagnant, and the Japanese market has slowed down mainly in the sales of
mini-vehicles due to the tax increase. Meanwhile, the development of automated driving technology, as well as
efforts toward improvement in environmental friendliness and safety, has made significant progress.
54