Toyota 2015 Annual Report Download - page 77
Download and view the complete annual report
Please find page 77 of the 2015 Toyota annual report below. You can navigate through the pages in the report by either clicking on the pages listed below, or by using the keyword search tool below to find specific information within the annual report.-
 1
1 -
2
-
3
-
4
-
5
-
6
-
7
-
8
-
9
-
10
-
11
-
12
-
13
-
14
-
15
-
16
-
17
-
18
-
19
-
20
-
21
-
22
-
23
-
24
-
25
-
26
-
27
-
28
-
29
-
30
-
31
-
32
-
33
-
34
-
35
-
36
-
37
-
38
-
39
-
40
-
41
-
42
-
43
-
44
-
45
-
46
-
47
-
48
-
49
-
50
-
51
-
52
-
53
-
54
-
55
-
56
-
57
-
58
-
59
-
60
-
61
-
62
-
63
-
64
-
65
-
66
-
 67
67 -
 68
68 -
 69
69 -
 70
70 -
 71
71 -
 72
72 -
 73
73 -
 74
74 -
 75
75 -
 76
76 -
 77
77 -
 78
78 -
 79
79 -
 80
80 -
 81
81 -
 82
82 -
 83
83 -
 84
84 -
 85
85 -
 86
86 -
 87
87 -
88
-
89
-
90
-
91
-
92
-
93
-
94
-
95
-
96
-
97
-
98
-
99
-
100
-
101
-
102
-
103
-
104
-
105
-
106
-
107
-
108
-
109
-
110
-
111
-
112
-
113
-
114
-
115
-
116
-
117
-
118
-
119
-
120
-
121
-
122
-
123
-
124
-
125
-
126
-
127
-
128
-
129
-
130
-
131
-
132
-
133
-
134
-
135
-
136
-
137
-
138
-
139
-
140
-
141
-
142
-
143
-
144
-
145
-
146
-
147
-
148
-
149
-
150
-
151
-
152
-
153
-
154
-
155
-
156
-
157
-
158
-
159
-
160
-
161
-
162
-
163
-
164
-
165
-
166
-
167
-
168
-
169
-
170
-
171
-
172
-
173
-
174
-
175
-
176
-
177
-
178
-
179
-
180
-
181
-
182
-
183
-
184
-
185
-
186
-
187
-
188
-
189
-
190
-
191
-
192
-
193
-
194
-
195
-
196
-
197
-
198
-
199
-
200
-
201
-
202
-
203
-
204
-
205
-
206
-
207
-
208
-
209
-
210
-
211
-
212
-
213
-
214
-
215
-
216
-
217
-
218
-
219
-
220
-
221
-
222
-
223
-
224
-
225
-
226
-
227
-
228
 |
 |

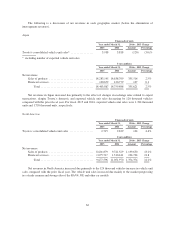
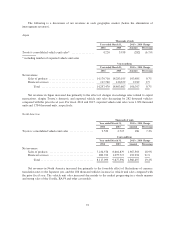
The following is a discussion of net revenues in each geographic market (before the elimination of
intersegment revenues).
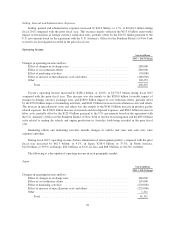
Japan
Thousands of units
Year ended March 31, 2015 v. 2014 Change
2014 2015 Amount Percentage
Toyota’s consolidated vehicle unit sales* ................ 4,220 3,938 (282) (6.7)%
* including number of exported vehicle unit sales
Yen in millions
Year ended March 31, 2015 v. 2014 Change
2014 2015 Amount Percentage
Net revenues:
Sales of products ................................ 14,179,710 14,283,195 103,485 0.7%
Financial services ............................... 117,760 120,672 2,912 2.5
Total ..................................... 14,297,470 14,403,867 106,397 0.7%
Net revenues in Japan increased due primarily to the effect of changes in exchange rates related to export
transactions, despite Toyota’s domestic and exported vehicle unit sales decreasing by 282 thousand vehicles
compared with the prior fiscal year. For fiscal 2014 and 2015, exported vehicle unit sales were 1,854 thousand
units and 1,784 thousand units, respectively.
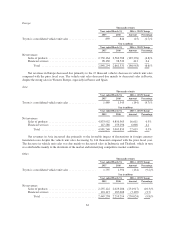
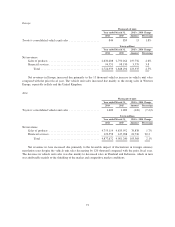
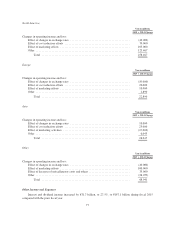
North America
Thousands of units
Year ended March 31, 2015 v. 2014 Change
2014 2015 Amount Percentage
Toyota’s consolidated vehicle unit sales ................. 2,529 2,715 186 7.3%
Yen in millions
Year ended March 31, 2015 v. 2014 Change
2014 2015 Amount Percentage
Net revenues:
Sales of products ............................... 7,234,376 8,601,879 1,367,503 18.9%
Financial services ............................... 882,723 1,075,717 192,994 21.9
Total ..................................... 8,117,099 9,677,596 1,560,497 19.2%
Net revenues in North America increased due primarily to the favorable effect of fluctuations of currency
translation rates to the Japanese yen, and the 186 thousand vehicles increase in vehicle unit sales compared with
the prior fiscal year. The vehicle unit sales increased due mainly to the market progressing in a steady manner
and strong sales of the Corolla, RAV4 and other car models.
72