Toyota 2015 Annual Report Download - page 73
Download and view the complete annual report
Please find page 73 of the 2015 Toyota annual report below. You can navigate through the pages in the report by either clicking on the pages listed below, or by using the keyword search tool below to find specific information within the annual report.-
 1
1 -
2
-
3
-
4
-
5
-
6
-
7
-
8
-
9
-
10
-
11
-
12
-
13
-
14
-
15
-
16
-
17
-
18
-
19
-
20
-
21
-
22
-
23
-
24
-
25
-
26
-
27
-
28
-
29
-
30
-
31
-
32
-
33
-
34
-
35
-
36
-
37
-
38
-
39
-
40
-
41
-
42
-
43
-
44
-
45
-
46
-
47
-
48
-
49
-
50
-
51
-
52
-
53
-
54
-
55
-
56
-
57
-
58
-
59
-
60
-
61
-
62
-
 63
63 -
 64
64 -
 65
65 -
 66
66 -
 67
67 -
 68
68 -
 69
69 -
 70
70 -
 71
71 -
 72
72 -
 73
73 -
 74
74 -
 75
75 -
 76
76 -
 77
77 -
 78
78 -
 79
79 -
 80
80 -
 81
81 -
 82
82 -
 83
83 -
84
-
85
-
86
-
87
-
88
-
89
-
90
-
91
-
92
-
93
-
94
-
95
-
96
-
97
-
98
-
99
-
100
-
101
-
102
-
103
-
104
-
105
-
106
-
107
-
108
-
109
-
110
-
111
-
112
-
113
-
114
-
115
-
116
-
117
-
118
-
119
-
120
-
121
-
122
-
123
-
124
-
125
-
126
-
127
-
128
-
129
-
130
-
131
-
132
-
133
-
134
-
135
-
136
-
137
-
138
-
139
-
140
-
141
-
142
-
143
-
144
-
145
-
146
-
147
-
148
-
149
-
150
-
151
-
152
-
153
-
154
-
155
-
156
-
157
-
158
-
159
-
160
-
161
-
162
-
163
-
164
-
165
-
166
-
167
-
168
-
169
-
170
-
171
-
172
-
173
-
174
-
175
-
176
-
177
-
178
-
179
-
180
-
181
-
182
-
183
-
184
-
185
-
186
-
187
-
188
-
189
-
190
-
191
-
192
-
193
-
194
-
195
-
196
-
197
-
198
-
199
-
200
-
201
-
202
-
203
-
204
-
205
-
206
-
207
-
208
-
209
-
210
-
211
-
212
-
213
-
214
-
215
-
216
-
217
-
218
-
219
-
220
-
221
-
222
-
223
-
224
-
225
-
226
-
227
-
228
 |
 |

2015 Japanese tax reforms. The effective tax rate for fiscal 2016 was 29.4%, which was lower than the statutory
tax rate in Japan. This was due mainly to the increase in tax credits and the effect of foreign subsidiaries where
statutory tax rates are lower than that of Japan.
Net Income Attributable to Noncontrolling Interests and Equity in Earnings of Affiliated Companies
Net income attributable to noncontrolling interests decreased by ¥13.0 billion, or 9.7%, to ¥121.5 billion
during fiscal 2016 compared with the prior fiscal year. This was due mainly to a decrease during fiscal 2016 in
net income attributable to the shareholders of consolidated subsidiaries.
Equity in earnings of affiliated companies during fiscal 2016 increased by ¥20.5 billion, or 6.7%, to
¥329.0 billion compared with the prior fiscal year. This increase was due mainly to an increase during fiscal 2016
in net income attributable to the shareholders of affiliated companies accounted for by the equity method.
Net Income Attributable to Toyota Motor Corporation
Net income attributable to the shareholders of Toyota Motor Corporation increased by ¥139.3 billion, or
6.4%, to ¥2,312.6 billion during fiscal 2016 compared with the prior fiscal year.
Net income attributable to common shareholders during fiscal 2016 is ¥2,306.6 billion, which is derived by
deducting dividends and accretion to Model AA Class Shares of ¥6.0 billion from net income attributable to
Toyota Motor Corporation.
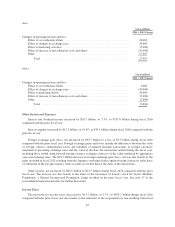
Other Comprehensive Income and Loss
Other comprehensive income and loss decreased by ¥1,816.1 billion to a loss of ¥866.7 billion for fiscal
2016 compared with the prior fiscal year. This decrease resulted from unrealized holding losses on securities in
fiscal 2016 of ¥302.6 billion compared with gains of ¥567.0 billion in the prior fiscal year due mainly to a
decrease in prices of marketable securities in stock exchange markets in Japan, from unfavorable foreign
currency translation adjustment losses of ¥362.9 billion in fiscal 2016 compared with gains of ¥380.4 billion in
the prior fiscal year due mainly to appreciation of the yen against the U.S. dollar, and from pension liability
adjustment losses in fiscal 2016 of ¥201.1 billion compared with gains of ¥1.9 billion in the prior fiscal year due
mainly to an increase in pension obligations resulting from decreasing discount rates in Japan and a decrease in
fair value of plan assets.
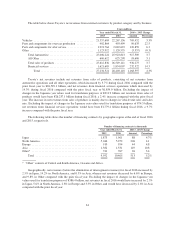
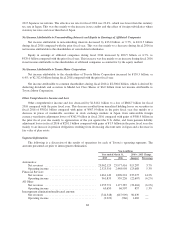
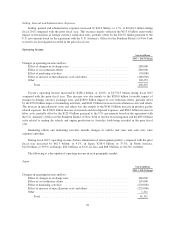
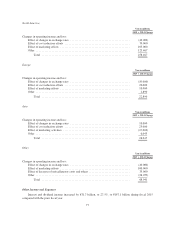
Segment Information
The following is a discussion of the results of operations for each of Toyota’s operating segments. The
amounts presented are prior to intersegment elimination.
Yen in millions
Year ended March 31, 2016 v. 2015 Change
2015 2016 Amount Percentage
Automotive:
Net revenues .................................... 25,062,129 25,977,416 915,287 3.7%
Operating income ................................ 2,325,310 2,448,998 123,688 5.3%
Financial Services:
Net revenues .................................... 1,661,149 1,896,224 235,075 14.2%
Operating income ................................ 361,833 339,226 (22,607) (6.2%)
All Other:
Net revenues .................................... 1,255,791 1,177,387 (78,404) (6.2%)
Operating income ................................ 65,650 66,507 857 1.3%
Intersegment elimination/unallocated amount:
Net revenues .................................... (744,548) (647,909) 96,639 —
Operating income ................................ (2,229) (760) 1,469 —
68