Toyota 2015 Annual Report Download - page 63
Download and view the complete annual report
Please find page 63 of the 2015 Toyota annual report below. You can navigate through the pages in the report by either clicking on the pages listed below, or by using the keyword search tool below to find specific information within the annual report.-
 1
1 -
2
-
3
-
4
-
5
-
6
-
7
-
8
-
9
-
10
-
11
-
12
-
13
-
14
-
15
-
16
-
17
-
18
-
19
-
20
-
21
-
22
-
23
-
24
-
25
-
26
-
27
-
28
-
29
-
30
-
31
-
32
-
33
-
34
-
35
-
36
-
37
-
38
-
39
-
40
-
41
-
42
-
43
-
44
-
45
-
46
-
47
-
48
-
49
-
50
-
51
-
52
-
 53
53 -
 54
54 -
 55
55 -
 56
56 -
 57
57 -
 58
58 -
 59
59 -
 60
60 -
 61
61 -
 62
62 -
 63
63 -
 64
64 -
 65
65 -
 66
66 -
 67
67 -
 68
68 -
 69
69 -
 70
70 -
 71
71 -
 72
72 -
 73
73 -
74
-
75
-
76
-
77
-
78
-
79
-
80
-
81
-
82
-
83
-
84
-
85
-
86
-
87
-
88
-
89
-
90
-
91
-
92
-
93
-
94
-
95
-
96
-
97
-
98
-
99
-
100
-
101
-
102
-
103
-
104
-
105
-
106
-
107
-
108
-
109
-
110
-
111
-
112
-
113
-
114
-
115
-
116
-
117
-
118
-
119
-
120
-
121
-
122
-
123
-
124
-
125
-
126
-
127
-
128
-
129
-
130
-
131
-
132
-
133
-
134
-
135
-
136
-
137
-
138
-
139
-
140
-
141
-
142
-
143
-
144
-
145
-
146
-
147
-
148
-
149
-
150
-
151
-
152
-
153
-
154
-
155
-
156
-
157
-
158
-
159
-
160
-
161
-
162
-
163
-
164
-
165
-
166
-
167
-
168
-
169
-
170
-
171
-
172
-
173
-
174
-
175
-
176
-
177
-
178
-
179
-
180
-
181
-
182
-
183
-
184
-
185
-
186
-
187
-
188
-
189
-
190
-
191
-
192
-
193
-
194
-
195
-
196
-
197
-
198
-
199
-
200
-
201
-
202
-
203
-
204
-
205
-
206
-
207
-
208
-
209
-
210
-
211
-
212
-
213
-
214
-
215
-
216
-
217
-
218
-
219
-
220
-
221
-
222
-
223
-
224
-
225
-
226
-
227
-
228
 |
 |
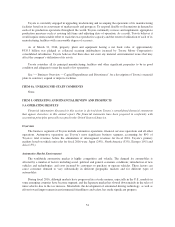
include general economic conditions, prevailing interest rates and Toyota’s financial strength. Funding costs
decreased during fiscal 2015 and 2016, mainly as a result of lower interest rates.
Toyota launched its credit card business in Japan in April 2001. As of March 31, 2015, Toyota had
13.5 million cardholders, an increase of 0.8 million cardholders compared with March 31, 2014. As of March 31,
2016, Toyota had 14.3 million cardholders, an increase of 0.8 million cardholders compared with March 31,
2015. Credit card receivables as of March 31, 2015 was ¥380.9 billion nearly equal to March 31, 2014, and that
as of March 31, 2016 increased by ¥2.7 billion from March 31, 2015 to ¥383.6 billion.
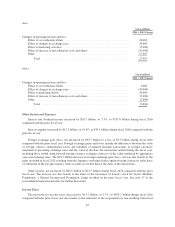
Other Business Operations
Toyota’s other business operations consist of housing (including the manufacture and sale of prefabricated
homes), information technology related businesses (including information technology and telecommunications,
intelligent transport systems and GAZOO) and other businesses.
Toyota does not expect its other business operations to materially contribute to Toyota’s consolidated results
of operations.
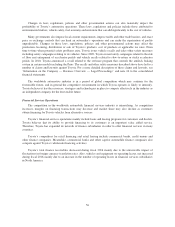
Currency Fluctuations
Toyota is affected by fluctuations in foreign currency exchange rates. Toyota is exposed to fluctuations in
the value of the Japanese yen against the U.S. dollar and the euro as well as the Australian dollar, the Russian
ruble, the Canadian dollar, the British pound, and others. Toyota’s consolidated financial statements, which are
presented in Japanese yen, are affected by foreign currency exchange fluctuations through both translation risk
and transaction risk.
Translation risk is the risk that Toyota’s consolidated financial statements for a particular period or for a
particular date will be affected by changes in the prevailing exchange rates of the currencies in those countries in
which Toyota does business compared with the Japanese yen. Even though the fluctuations of currency exchange
rates to the Japanese yen can be substantial, and, therefore, significantly impact comparisons with prior periods
and among the various geographic markets, the translation risk is a reporting consideration and does not reflect
Toyota’s underlying results of operations. Toyota does not hedge against translation risk.
Transaction risk is the risk that the currency structure of Toyota’s costs and liabilities will deviate from the
currency structure of sales proceeds and assets. Transaction risk relates primarily to sales proceeds from Toyota’s
non-domestic operations from vehicles produced in Japan.
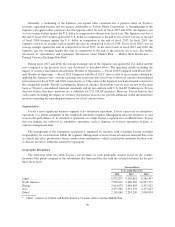
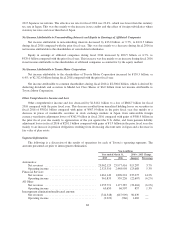
Toyota believes that the location of its production facilities in different parts of the world has significantly
reduced the level of transaction risk. As part of its globalization strategy, Toyota has continued to localize
production by constructing production facilities in the major markets in which it sells its vehicles. In calendar
2014 and 2015, Toyota produced 76.5% and 75.1%, respectively, of its non-domestic sales outside Japan. In
North America, 74.4% and 72.2% of vehicles sold in calendar 2014 and 2015, respectively, were produced
locally. In Europe, 73.7% and 76.3% of vehicles sold in calendar 2014 and 2015, respectively, were produced
locally. Localizing production enables Toyota to locally purchase many of the supplies and resources used in the
production process, which allows for a better match of local currency revenues with local currency expenses.
Toyota also enters into foreign currency transactions and other hedging instruments to address a portion of
its transaction risk. This has reduced, but not eliminated, the effects of foreign currency exchange rate
fluctuations, which in some years can be significant. See notes 21 and 27 to the consolidated financial statements
for additional information.
58