Toyota 2015 Annual Report Download - page 204
Download and view the complete annual report
Please find page 204 of the 2015 Toyota annual report below. You can navigate through the pages in the report by either clicking on the pages listed below, or by using the keyword search tool below to find specific information within the annual report.-
 1
1 -
2
-
3
-
4
-
5
-
6
-
7
-
8
-
9
-
10
-
11
-
12
-
13
-
14
-
15
-
16
-
17
-
18
-
19
-
20
-
21
-
22
-
23
-
24
-
25
-
26
-
27
-
28
-
29
-
30
-
31
-
32
-
33
-
34
-
35
-
36
-
37
-
38
-
39
-
40
-
41
-
42
-
43
-
44
-
45
-
46
-
47
-
48
-
49
-
50
-
51
-
52
-
53
-
54
-
55
-
56
-
57
-
58
-
59
-
60
-
61
-
62
-
63
-
64
-
65
-
66
-
67
-
68
-
69
-
70
-
71
-
72
-
73
-
74
-
75
-
76
-
77
-
78
-
79
-
80
-
81
-
82
-
83
-
84
-
85
-
86
-
87
-
88
-
89
-
90
-
91
-
92
-
93
-
94
-
95
-
96
-
97
-
98
-
99
-
100
-
101
-
102
-
103
-
104
-
105
-
106
-
107
-
108
-
109
-
110
-
111
-
112
-
113
-
114
-
115
-
116
-
117
-
118
-
119
-
120
-
121
-
122
-
123
-
124
-
125
-
126
-
127
-
128
-
129
-
130
-
131
-
132
-
133
-
134
-
135
-
136
-
137
-
138
-
139
-
140
-
141
-
142
-
143
-
144
-
145
-
146
-
147
-
148
-
149
-
150
-
151
-
152
-
153
-
154
-
155
-
156
-
157
-
158
-
159
-
160
-
161
-
162
-
163
-
164
-
165
-
166
-
167
-
168
-
169
-
170
-
171
-
172
-
173
-
174
-
175
-
176
-
177
-
178
-
179
-
180
-
181
-
182
-
183
-
184
-
185
-
186
-
187
-
188
-
189
-
190
-
191
-
192
-
193
-
 194
194 -
 195
195 -
 196
196 -
 197
197 -
 198
198 -
 199
199 -
 200
200 -
 201
201 -
 202
202 -
 203
203 -
 204
204 -
 205
205 -
 206
206 -
 207
207 -
 208
208 -
 209
209 -
 210
210 -
 211
211 -
 212
212 -
 213
213 -
 214
214 -
215
-
216
-
217
-
218
-
219
-
220
-
221
-
222
-
223
-
224
-
225
-
226
-
227
-
228
 |
 |

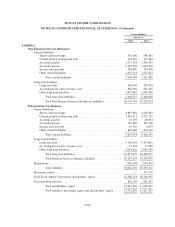
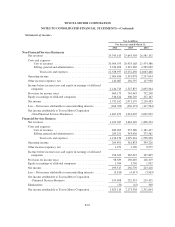
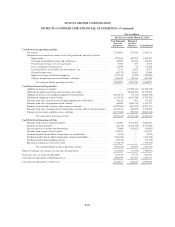
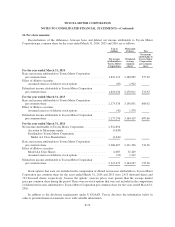
TOYOTA MOTOR CORPORATION
NOTES TO CONSOLIDATED FINANCIAL STATEMENTS—(Continued)
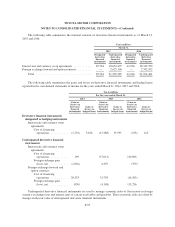
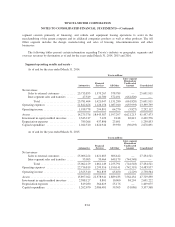
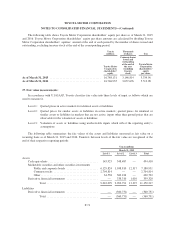
As of and for the year ended March 31, 2015:
Yen in millions
Japan
North
America Europe Asia Other
Inter-segment
Elimination/
Unallocated
Amount Consolidated
Net revenues
Sales to external
customers ........ 8,338,881 9,430,450 2,690,803 4,531,178 2,243,209 — 27,234,521
Inter-segment sales
and transfers ..... 6,064,986 247,146 157,491 450,062 206,029 (7,125,714) —
Total ......... 14,403,867 9,677,596 2,848,294 4,981,240 2,449,238 (7,125,714) 27,234,521
Operating expenses ...... 12,832,391 9,093,077 2,767,176 4,559,458 2,337,729 (7,105,874) 24,483,957
Operating income ....... 1,571,476 584,519 81,118 421,782 111,509 (19,840) 2,750,564
Assets ................ 14,466,432 16,961,700 2,640,054 4,753,850 2,903,474 6,004,320 47,729,830
Long-lived assets ........ 3,062,463 4,632,536 301,736 874,207 424,777 — 9,295,719
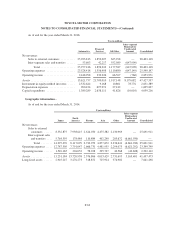
As of and for the year ended March 31, 2016:
Yen in millions
Japan
North
America Europe Asia Other
Inter-segment
Elimination/
Unallocated
Amount Consolidated
Net revenues
Sales to external
customers ........ 8,588,437 10,822,772 2,507,292 4,475,623 2,008,994 — 28,403,118
Inter-segment sales
and transfers ..... 6,171,051 229,198 154,039 528,236 201,220 (7,283,744) —
Total ......... 14,759,488 11,051,970 2,661,331 5,003,859 2,210,214 (7,283,744) 28,403,118
Operating expenses ...... 13,081,966 10,523,151 2,588,915 4,554,670 2,101,305 (7,300,860) 25,549,147
Operating income ....... 1,677,522 528,819 72,416 449,189 108,909 17,116 2,853,971
Assets ................ 14,291,434 16,622,979 2,612,210 4,415,700 2,579,113 6,906,161 47,427,597
Long-lived assets ........ 3,210,376 4,958,989 309,657 869,989 391,406 — 9,740,417
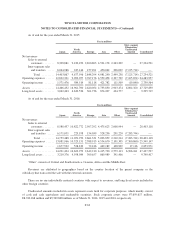
“Other” consists of Central and South America, Oceania, Africa and the Middle East.
Revenues are attributed to geographies based on the country location of the parent company or the
subsidiary that transacted the sale with the external customer.
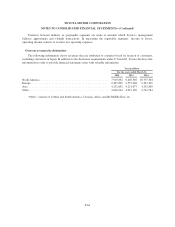
There are no any individually material countries with respect to revenues, and long-lived assets included in
other foreign countries.
Unallocated amounts included in assets represent assets held for corporate purposes, which mainly consist
of cash and cash equivalents and marketable securities. Such corporate assets were ¥7,659,617 million,
¥8,742,168 million and ¥9,369,868 million, as of March 31, 2014, 2015 and 2016, respectively.
F-63