Toyota 2015 Annual Report Download - page 82
Download and view the complete annual report
Please find page 82 of the 2015 Toyota annual report below. You can navigate through the pages in the report by either clicking on the pages listed below, or by using the keyword search tool below to find specific information within the annual report.-
 1
1 -
2
-
3
-
4
-
5
-
6
-
7
-
8
-
9
-
10
-
11
-
12
-
13
-
14
-
15
-
16
-
17
-
18
-
19
-
20
-
21
-
22
-
23
-
24
-
25
-
26
-
27
-
28
-
29
-
30
-
31
-
32
-
33
-
34
-
35
-
36
-
37
-
38
-
39
-
40
-
41
-
42
-
43
-
44
-
45
-
46
-
47
-
48
-
49
-
50
-
51
-
52
-
53
-
54
-
55
-
56
-
57
-
58
-
59
-
60
-
61
-
62
-
63
-
64
-
65
-
66
-
67
-
68
-
69
-
70
-
71
-
 72
72 -
 73
73 -
 74
74 -
 75
75 -
 76
76 -
 77
77 -
 78
78 -
 79
79 -
 80
80 -
 81
81 -
 82
82 -
 83
83 -
 84
84 -
 85
85 -
 86
86 -
 87
87 -
 88
88 -
 89
89 -
 90
90 -
 91
91 -
 92
92 -
93
-
94
-
95
-
96
-
97
-
98
-
99
-
100
-
101
-
102
-
103
-
104
-
105
-
106
-
107
-
108
-
109
-
110
-
111
-
112
-
113
-
114
-
115
-
116
-
117
-
118
-
119
-
120
-
121
-
122
-
123
-
124
-
125
-
126
-
127
-
128
-
129
-
130
-
131
-
132
-
133
-
134
-
135
-
136
-
137
-
138
-
139
-
140
-
141
-
142
-
143
-
144
-
145
-
146
-
147
-
148
-
149
-
150
-
151
-
152
-
153
-
154
-
155
-
156
-
157
-
158
-
159
-
160
-
161
-
162
-
163
-
164
-
165
-
166
-
167
-
168
-
169
-
170
-
171
-
172
-
173
-
174
-
175
-
176
-
177
-
178
-
179
-
180
-
181
-
182
-
183
-
184
-
185
-
186
-
187
-
188
-
189
-
190
-
191
-
192
-
193
-
194
-
195
-
196
-
197
-
198
-
199
-
200
-
201
-
202
-
203
-
204
-
205
-
206
-
207
-
208
-
209
-
210
-
211
-
212
-
213
-
214
-
215
-
216
-
217
-
218
-
219
-
220
-
221
-
222
-
223
-
224
-
225
-
226
-
227
-
228
 |
 |

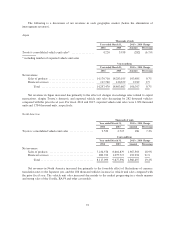
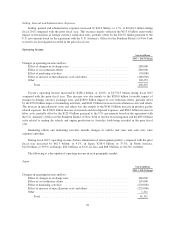
North America
Yen in millions
2015 v. 2014 Change
Changes in operating income and loss:
Effect of changes in exchange rates .......................................... (40,000)
Effect of cost reduction efforts .............................................. 70,000
Effect of marketing efforts ................................................. 105,000
Other .................................................................. 123,467
Total .............................................................. 258,467
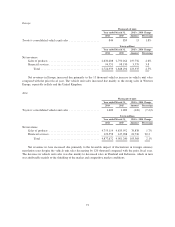
Europe
Yen in millions
2015 v. 2014 Change
Changes in operating income and loss:
Effect of changes in exchange rates .......................................... (10,000)
Effect of cost reduction efforts .............................................. 20,000
Effect of marketing efforts ................................................. 10,000
Other .................................................................. 2,890
Total .............................................................. 22,890
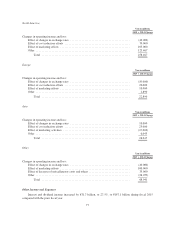
Asia
Yen in millions
2015 v. 2014 Change
Changes in operating income and loss:
Effect of changes in exchange rates .......................................... 10,000
Effect of cost reduction efforts .............................................. 25,000
Effect of marketing activities ............................................... (15,000)
Other .................................................................. 6,045
Total .............................................................. 26,045
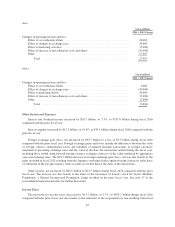
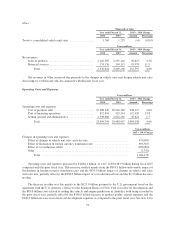
Other
Yen in millions
2015 v. 2014 Change
Changes in operating income and loss:
Effect of changes in exchange rates .......................................... (40,000)
Effect of marketing efforts ................................................. 100,000
Effect of decrease of miscellaneous costs and others ............................. 35,000
Other .................................................................. (26,059)
Total .............................................................. 68,941
Other Income and Expenses
Interest and dividend income increased by ¥31.7 billion, or 27.5%, to ¥147.1 billion during fiscal 2015
compared with the prior fiscal year.
77