Toyota 2015 Annual Report Download - page 206
Download and view the complete annual report
Please find page 206 of the 2015 Toyota annual report below. You can navigate through the pages in the report by either clicking on the pages listed below, or by using the keyword search tool below to find specific information within the annual report.-
 1
1 -
2
-
3
-
4
-
5
-
6
-
7
-
8
-
9
-
10
-
11
-
12
-
13
-
14
-
15
-
16
-
17
-
18
-
19
-
20
-
21
-
22
-
23
-
24
-
25
-
26
-
27
-
28
-
29
-
30
-
31
-
32
-
33
-
34
-
35
-
36
-
37
-
38
-
39
-
40
-
41
-
42
-
43
-
44
-
45
-
46
-
47
-
48
-
49
-
50
-
51
-
52
-
53
-
54
-
55
-
56
-
57
-
58
-
59
-
60
-
61
-
62
-
63
-
64
-
65
-
66
-
67
-
68
-
69
-
70
-
71
-
72
-
73
-
74
-
75
-
76
-
77
-
78
-
79
-
80
-
81
-
82
-
83
-
84
-
85
-
86
-
87
-
88
-
89
-
90
-
91
-
92
-
93
-
94
-
95
-
96
-
97
-
98
-
99
-
100
-
101
-
102
-
103
-
104
-
105
-
106
-
107
-
108
-
109
-
110
-
111
-
112
-
113
-
114
-
115
-
116
-
117
-
118
-
119
-
120
-
121
-
122
-
123
-
124
-
125
-
126
-
127
-
128
-
129
-
130
-
131
-
132
-
133
-
134
-
135
-
136
-
137
-
138
-
139
-
140
-
141
-
142
-
143
-
144
-
145
-
146
-
147
-
148
-
149
-
150
-
151
-
152
-
153
-
154
-
155
-
156
-
157
-
158
-
159
-
160
-
161
-
162
-
163
-
164
-
165
-
166
-
167
-
168
-
169
-
170
-
171
-
172
-
173
-
174
-
175
-
176
-
177
-
178
-
179
-
180
-
181
-
182
-
183
-
184
-
185
-
186
-
187
-
188
-
189
-
190
-
191
-
192
-
193
-
194
-
195
-
 196
196 -
 197
197 -
 198
198 -
 199
199 -
 200
200 -
 201
201 -
 202
202 -
 203
203 -
 204
204 -
 205
205 -
 206
206 -
 207
207 -
 208
208 -
 209
209 -
 210
210 -
 211
211 -
 212
212 -
 213
213 -
 214
214 -
 215
215 -
 216
216 -
217
-
218
-
219
-
220
-
221
-
222
-
223
-
224
-
225
-
226
-
227
-
228
 |
 |

TOYOTA MOTOR CORPORATION
NOTES TO CONSOLIDATED FINANCIAL STATEMENTS—(Continued)
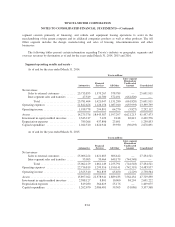
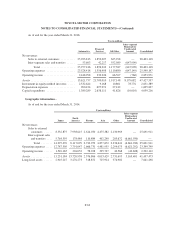
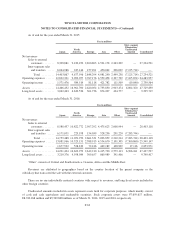
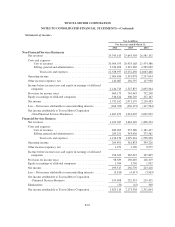
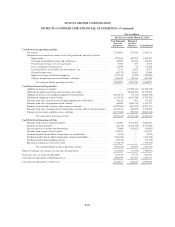
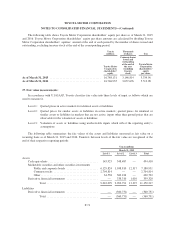
Certain financial statements data on non-financial services and financial services businesses -
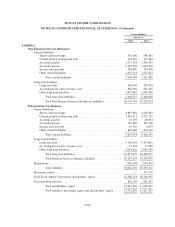
The financial data below presents separately Toyota’s non-financial services and financial services
businesses.
Balance sheets -
Yen in millions
March 31,
2015 2016
Assets
Non-Financial Services Businesses
Current assets
Cash and cash equivalents .................................... 1,680,994 2,318,152
Marketable securities ....................................... 2,251,581 1,210,427
Trade accounts and notes receivable, less allowance for doubtful
accounts ................................................ 2,178,984 2,089,216
Inventories ................................................ 2,137,021 2,061,113
Prepaid expenses and other current assets ....................... 1,898,558 3,341,150
Total current assets ..................................... 10,147,138 11,020,058
Investments and other assets ...................................... 10,765,747 10,204,760
Property, plant and equipment .................................... 5,346,553 5,426,247
Total Non-Financial Services Businesses assets ............... 26,259,438 26,651,065
Financial Services Business
Current assets
Cash and cash equivalents .................................... 603,563 621,276
Marketable securities ....................................... 530,518 300,962
Finance receivables, net ..................................... 6,269,862 5,912,684
Prepaid expenses and other current assets ....................... 1,007,249 895,257
Total current assets ..................................... 8,411,192 7,730,179
Noncurrent finance receivables, net ................................ 9,202,531 8,642,947
Investments and other assets ...................................... 816,052 1,021,714
Property, plant and equipment .................................... 3,949,166 4,314,170
Total Financial Services Business assets .................... 22,378,941 21,709,010
Eliminations .................................................. (908,549) (932,478)
Total assets ........................................... 47,729,830 47,427,597
Assets in the non-financial services include unallocated corporate assets.
F-65