Toyota 2015 Annual Report Download - page 60
Download and view the complete annual report
Please find page 60 of the 2015 Toyota annual report below. You can navigate through the pages in the report by either clicking on the pages listed below, or by using the keyword search tool below to find specific information within the annual report.-
 1
1 -
2
-
3
-
4
-
5
-
6
-
7
-
8
-
9
-
10
-
11
-
12
-
13
-
14
-
15
-
16
-
17
-
18
-
19
-
20
-
21
-
22
-
23
-
24
-
25
-
26
-
27
-
28
-
29
-
30
-
31
-
32
-
33
-
34
-
35
-
36
-
37
-
38
-
39
-
40
-
41
-
42
-
43
-
44
-
45
-
46
-
47
-
48
-
49
-
 50
50 -
 51
51 -
 52
52 -
 53
53 -
 54
54 -
 55
55 -
 56
56 -
 57
57 -
 58
58 -
 59
59 -
 60
60 -
 61
61 -
 62
62 -
 63
63 -
 64
64 -
 65
65 -
 66
66 -
 67
67 -
 68
68 -
 69
69 -
 70
70 -
71
-
72
-
73
-
74
-
75
-
76
-
77
-
78
-
79
-
80
-
81
-
82
-
83
-
84
-
85
-
86
-
87
-
88
-
89
-
90
-
91
-
92
-
93
-
94
-
95
-
96
-
97
-
98
-
99
-
100
-
101
-
102
-
103
-
104
-
105
-
106
-
107
-
108
-
109
-
110
-
111
-
112
-
113
-
114
-
115
-
116
-
117
-
118
-
119
-
120
-
121
-
122
-
123
-
124
-
125
-
126
-
127
-
128
-
129
-
130
-
131
-
132
-
133
-
134
-
135
-
136
-
137
-
138
-
139
-
140
-
141
-
142
-
143
-
144
-
145
-
146
-
147
-
148
-
149
-
150
-
151
-
152
-
153
-
154
-
155
-
156
-
157
-
158
-
159
-
160
-
161
-
162
-
163
-
164
-
165
-
166
-
167
-
168
-
169
-
170
-
171
-
172
-
173
-
174
-
175
-
176
-
177
-
178
-
179
-
180
-
181
-
182
-
183
-
184
-
185
-
186
-
187
-
188
-
189
-
190
-
191
-
192
-
193
-
194
-
195
-
196
-
197
-
198
-
199
-
200
-
201
-
202
-
203
-
204
-
205
-
206
-
207
-
208
-
209
-
210
-
211
-
212
-
213
-
214
-
215
-
216
-
217
-
218
-
219
-
220
-
221
-
222
-
223
-
224
-
225
-
226
-
227
-
228
 |
 |

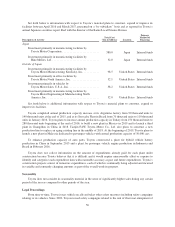
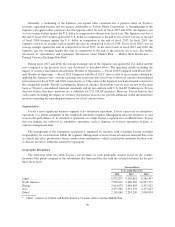
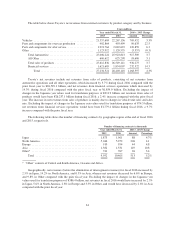
The following table sets forth Toyota’s consolidated vehicle unit sales by geographic market based on
location of customers for the past three fiscal years.
Thousands of units
Year Ended March 31,
2014 2015 2016
Japan ................................................................... 2,365 2,154 2,059
North America ........................................................... 2,529 2,715 2,839
Europe ................................................................. 844 859 844
Asia .................................................................... 1,609 1,489 1,345
Other* .................................................................. 1,769 1,755 1,594
Overseas total ............................................................ 6,751 6,818 6,622
Total ................................................................... 9,116 8,972 8,681
* “Other” consists of Central and South America, Oceania, Africa and the Middle East, etc.
In each of fiscal 2015 and fiscal 2016, during which the market in Japan experienced downturns, Toyota’s
consolidated vehicle unit sales in Japan decreased compared to the previous fiscal year. Through the efforts of
dealers nationwide, for fiscal 2015 and fiscal 2016, the Toyota and Lexus brands’ market share excluding
mini-vehicles was 46.0% and 46.8%, and the market share (including Daihatsu and Hino brands) including
mini-vehicles was 41.8% and 43.2%, each remaining at a high level, as was the case in fiscal 2014. Overseas
consolidated vehicle unit sales increased as a whole during fiscal 2015, due to increased sales in North America
and Europe, while vehicle unit sales decreased as a whole during fiscal 2016, due mainly to decreases in Asia and
the Middle East, despite an increase in North America.
Toyota’s share of total vehicle unit sales in each market is influenced by the quality, safety, reliability, price,
design, performance, economy and utility of Toyota’s vehicles compared with those offered by other
manufacturers. The timely introduction of new or redesigned vehicles is also an important factor in satisfying
customer needs. Toyota’s ability to satisfy changing customer preferences can affect its revenues and earnings
significantly.
The profitability of Toyota’s automotive operations is affected by many factors. These factors include:
• vehicle unit sales volumes,
• the mix of vehicle models and options sold,
• the level of parts and service sales,
• the levels of price discounts and other sales incentives and marketing costs,
• the cost of customer warranty claims and other customer satisfaction actions,
• the cost of research and development and other fixed costs,
• the prices of raw materials,
• the ability to control costs,
• the efficient use of production capacity,
• the adverse effect on production due to the reliance on various suppliers for the provision of supplies,
• the adverse effect on market, sales and productions of natural calamities and interruptions of social
infrastructure, and
• changes in the value of the Japanese yen and other currencies in which Toyota conducts business.
55