Toyota 2015 Annual Report Download - page 84
Download and view the complete annual report
Please find page 84 of the 2015 Toyota annual report below. You can navigate through the pages in the report by either clicking on the pages listed below, or by using the keyword search tool below to find specific information within the annual report.-
 1
1 -
2
-
3
-
4
-
5
-
6
-
7
-
8
-
9
-
10
-
11
-
12
-
13
-
14
-
15
-
16
-
17
-
18
-
19
-
20
-
21
-
22
-
23
-
24
-
25
-
26
-
27
-
28
-
29
-
30
-
31
-
32
-
33
-
34
-
35
-
36
-
37
-
38
-
39
-
40
-
41
-
42
-
43
-
44
-
45
-
46
-
47
-
48
-
49
-
50
-
51
-
52
-
53
-
54
-
55
-
56
-
57
-
58
-
59
-
60
-
61
-
62
-
63
-
64
-
65
-
66
-
67
-
68
-
69
-
70
-
71
-
72
-
73
-
 74
74 -
 75
75 -
 76
76 -
 77
77 -
 78
78 -
 79
79 -
 80
80 -
 81
81 -
 82
82 -
 83
83 -
 84
84 -
 85
85 -
 86
86 -
 87
87 -
 88
88 -
 89
89 -
 90
90 -
 91
91 -
 92
92 -
 93
93 -
 94
94 -
95
-
96
-
97
-
98
-
99
-
100
-
101
-
102
-
103
-
104
-
105
-
106
-
107
-
108
-
109
-
110
-
111
-
112
-
113
-
114
-
115
-
116
-
117
-
118
-
119
-
120
-
121
-
122
-
123
-
124
-
125
-
126
-
127
-
128
-
129
-
130
-
131
-
132
-
133
-
134
-
135
-
136
-
137
-
138
-
139
-
140
-
141
-
142
-
143
-
144
-
145
-
146
-
147
-
148
-
149
-
150
-
151
-
152
-
153
-
154
-
155
-
156
-
157
-
158
-
159
-
160
-
161
-
162
-
163
-
164
-
165
-
166
-
167
-
168
-
169
-
170
-
171
-
172
-
173
-
174
-
175
-
176
-
177
-
178
-
179
-
180
-
181
-
182
-
183
-
184
-
185
-
186
-
187
-
188
-
189
-
190
-
191
-
192
-
193
-
194
-
195
-
196
-
197
-
198
-
199
-
200
-
201
-
202
-
203
-
204
-
205
-
206
-
207
-
208
-
209
-
210
-
211
-
212
-
213
-
214
-
215
-
216
-
217
-
218
-
219
-
220
-
221
-
222
-
223
-
224
-
225
-
226
-
227
-
228
 |
 |

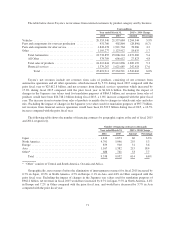
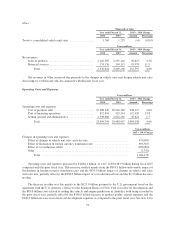
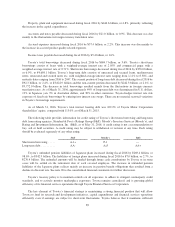
Segment Information
The following is a discussion of the results of operations for each of Toyota’s operating segments. The
amounts presented are prior to intersegment elimination.
Yen in millions
Year ended March 31, 2015 v. 2014 Change
2014 2015 Amount Percentage
Automotive:
Net revenues ................................... 23,781,404 25,062,129 1,280,725 5.4%
Operating income ............................... 1,938,778 2,325,310 386,532 19.9
Financial Services:
Net revenues ................................... 1,421,047 1,661,149 240,102 16.9
Operating income ............................... 294,891 361,833 66,942 22.7
All Other:
Net revenues ................................... 1,151,280 1,255,791 104,511 9.1
Operating income ............................... 64,270 65,650 1,380 2.1
Intersegment elimination/unallocated amount:
Net revenues ................................... (661,820) (744,548) (82,728) —
Operating income ............................... (5,827) (2,229) 3,598 —
Automotive Operations Segment
The automotive operations segment is Toyota’s largest operating segment by net revenues. Net revenues for
the automotive segment increased during fiscal 2015 by ¥1,280.7 billion, or 5.4%, to ¥25,062.1 billion compared
with the prior fiscal year. The increase mainly reflects the ¥860.1 billion favorable impact of fluctuations in
foreign currency translation rates and the ¥360.0 billion favorable impact of changes in vehicle unit sales and
sales mix.
Operating income from the automotive operations increased by ¥386.5 billion, or 19.9%, to ¥2,325.3 billion
during fiscal 2015 compared with the prior fiscal year. This increase in operating income was due mainly to the
¥280.0 billion favorable impact of changes in foreign currency exchange rates and the ¥280.0 billion impact of
cost reduction efforts, partially offset by the ¥70.0 billion impact of marketing activities and the ¥160.0 billion
increase in miscellaneous costs and others.
The impact of marketing activities was due primarily to the decrease in Toyota’s vehicle unit sales by
144 thousand vehicles compared with the prior fiscal year. Although the vehicle unit sales in North America
increased due mainly to the market progressing in a steady manner, the vehicle unit sales overall decreased due
mainly to the market downturn in Japan resulting from the consumption tax increase and the market downturn in
major Asian countries. The increase in miscellaneous costs and others was due mainly to the ¥140.0 billion
increase in product quality related expenses, the ¥100.0 billion increase in research and development expenses
and the ¥80.0 billion increase in labor costs, partially offset by the ¥125.0 billion payment to the
U.S. government based on the agreement with the U.S. Attorney’s Office for the Southern District of New York
to resolve its investigation recorded in the prior fiscal year.
Financial Services Operations Segment
Net revenues for the financial services operations increased during fiscal 2015 by ¥240.1 billion, or 16.9%,
to ¥1,661.1 billion compared with the prior fiscal year. This increase was primarily due to the ¥98.2 billion
favorable impact of fluctuations in foreign currency translation rates.
Operating income from financial services operations increased by ¥66.9 billion, or 22.7%, to ¥361.8 billion
during fiscal 2015 compared with the prior fiscal year. This increase was due primarily to the recording of
¥61.9 billion of valuation gains on interest rate swaps stated at fair value, mainly in North America.
79