Toyota 2015 Annual Report Download - page 15
Download and view the complete annual report
Please find page 15 of the 2015 Toyota annual report below. You can navigate through the pages in the report by either clicking on the pages listed below, or by using the keyword search tool below to find specific information within the annual report.-
 1
1 -
2
-
3
-
4
-
 5
5 -
 6
6 -
 7
7 -
 8
8 -
 9
9 -
 10
10 -
 11
11 -
 12
12 -
 13
13 -
 14
14 -
 15
15 -
 16
16 -
 17
17 -
 18
18 -
 19
19 -
 20
20 -
 21
21 -
 22
22 -
 23
23 -
 24
24 -
 25
25 -
26
-
27
-
28
-
29
-
30
-
31
-
32
-
33
-
34
-
35
-
36
-
37
-
38
-
39
-
40
-
41
-
42
-
43
-
44
-
45
-
46
-
47
-
48
-
49
-
50
-
51
-
52
-
53
-
54
-
55
-
56
-
57
-
58
-
59
-
60
-
61
-
62
-
63
-
64
-
65
-
66
-
67
-
68
-
69
-
70
-
71
-
72
-
73
-
74
-
75
-
76
-
77
-
78
-
79
-
80
-
81
-
82
-
83
-
84
-
85
-
86
-
87
-
88
-
89
-
90
-
91
-
92
-
93
-
94
-
95
-
96
-
97
-
98
-
99
-
100
-
101
-
102
-
103
-
104
-
105
-
106
-
107
-
108
-
109
-
110
-
111
-
112
-
113
-
114
-
115
-
116
-
117
-
118
-
119
-
120
-
121
-
122
-
123
-
124
-
125
-
126
-
127
-
128
-
129
-
130
-
131
-
132
-
133
-
134
-
135
-
136
-
137
-
138
-
139
-
140
-
141
-
142
-
143
-
144
-
145
-
146
-
147
-
148
-
149
-
150
-
151
-
152
-
153
-
154
-
155
-
156
-
157
-
158
-
159
-
160
-
161
-
162
-
163
-
164
-
165
-
166
-
167
-
168
-
169
-
170
-
171
-
172
-
173
-
174
-
175
-
176
-
177
-
178
-
179
-
180
-
181
-
182
-
183
-
184
-
185
-
186
-
187
-
188
-
189
-
190
-
191
-
192
-
193
-
194
-
195
-
196
-
197
-
198
-
199
-
200
-
201
-
202
-
203
-
204
-
205
-
206
-
207
-
208
-
209
-
210
-
211
-
212
-
213
-
214
-
215
-
216
-
217
-
218
-
219
-
220
-
221
-
222
-
223
-
224
-
225
-
226
-
227
-
228
 |
 |
The Worldwide Automotive Market
Toyota estimates that annual worldwide vehicle sales totaled approximately 91 million units in 2015.
Automobile sales are affected by a number of factors including:
• social, political and economic conditions;
• introduction of new vehicles and technologies; and
• costs incurred by customers to purchase and operate automobiles.
These factors can cause consumer demand to vary substantially from year to year in different geographic
markets and in individual categories of automobiles.
In fiscal 2016, the U.S. economy experienced steady growth, with Europe undergoing gradual recovery
following additional monetary easing measures while the economy in Japan lacked strength as the improvement
in the jobs market did not impact income and consumption remained low. Growth in emerging markets slowed
due to weakness of local currencies deriving partly from a downturn in the Chinese economy, as well as a decline
in prices of natural resources in resource-producing countries.
The automotive industry was also impacted by this trend. In 2015, with respect to developed countries,
markets in Europe and the United States expanded. In addition, in Japan, market demand decreased despite a
recovery in general consumption levels and signs of recovery from the consumption tax increase in April 2014.
In emerging markets, the expansion of the Chinese market continued, but markets in other emerging countries
contracted.
However, in the medium- to long-term, Toyota expects the automotive market to grow driven principally by
the growth in emerging markets. Global competition is expected to be severe, as competition in compact and
low-price vehicles intensifies, and technological development and development of new products become more
frequent with a heightened global awareness of the environment and more stringent fuel economy standards.
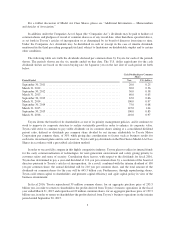
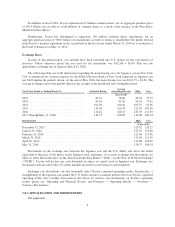
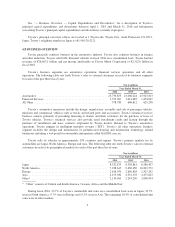
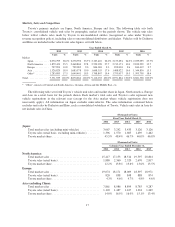
In 2015, China, North America, Europe and Asia were the world’s largest automotive markets. The share of
each market across the globe, which Toyota estimates based on the available automobile sales data in each
country and region information, was 28% for China, 23% for North America (22% excluding Mexico and Puerto
Rico), 21% for Europe and 10% for Asia. In China, new vehicle sales increased to approximately 25.0 million
units. In North America, new vehicle sales increased to approximately 20.8 million units. In Europe, new vehicle
sales increased to approximately 19.0 million units. In Asia (including India but excluding Japan and China), new
vehicle unit sales increased from the previous year to approximately 9.3 million units.
The worldwide automotive industry is affected significantly by government regulations aimed at reducing
harmful effects on the environment, enhancing vehicle safety and improving fuel economy. These regulations
have added to the cost of manufacturing vehicles. Many governments also mandate local procurement of parts
and components and impose tariffs and other trade barriers and price or exchange controls as a means of creating
jobs, protecting domestic producers or influencing their balance of payments. Changes in regulatory
requirements and other government-imposed restrictions can limit an automaker’s operations. These regulations
can also make it difficult to repatriate profits to an automaker’s home country.
The development of the worldwide automotive market includes the continuing globalization of automotive
operations. Manufacturers seek to achieve globalization by localizing the design and manufacture of automobiles
and their parts and components in the markets in which they are sold. By expanding production capabilities
beyond their home markets, automotive manufacturers are able to reduce their exposure to fluctuations in foreign
exchange rates as well as to trade restrictions and tariffs.
10