Toyota 2015 Annual Report Download - page 202
Download and view the complete annual report
Please find page 202 of the 2015 Toyota annual report below. You can navigate through the pages in the report by either clicking on the pages listed below, or by using the keyword search tool below to find specific information within the annual report.-
 1
1 -
2
-
3
-
4
-
5
-
6
-
7
-
8
-
9
-
10
-
11
-
12
-
13
-
14
-
15
-
16
-
17
-
18
-
19
-
20
-
21
-
22
-
23
-
24
-
25
-
26
-
27
-
28
-
29
-
30
-
31
-
32
-
33
-
34
-
35
-
36
-
37
-
38
-
39
-
40
-
41
-
42
-
43
-
44
-
45
-
46
-
47
-
48
-
49
-
50
-
51
-
52
-
53
-
54
-
55
-
56
-
57
-
58
-
59
-
60
-
61
-
62
-
63
-
64
-
65
-
66
-
67
-
68
-
69
-
70
-
71
-
72
-
73
-
74
-
75
-
76
-
77
-
78
-
79
-
80
-
81
-
82
-
83
-
84
-
85
-
86
-
87
-
88
-
89
-
90
-
91
-
92
-
93
-
94
-
95
-
96
-
97
-
98
-
99
-
100
-
101
-
102
-
103
-
104
-
105
-
106
-
107
-
108
-
109
-
110
-
111
-
112
-
113
-
114
-
115
-
116
-
117
-
118
-
119
-
120
-
121
-
122
-
123
-
124
-
125
-
126
-
127
-
128
-
129
-
130
-
131
-
132
-
133
-
134
-
135
-
136
-
137
-
138
-
139
-
140
-
141
-
142
-
143
-
144
-
145
-
146
-
147
-
148
-
149
-
150
-
151
-
152
-
153
-
154
-
155
-
156
-
157
-
158
-
159
-
160
-
161
-
162
-
163
-
164
-
165
-
166
-
167
-
168
-
169
-
170
-
171
-
172
-
173
-
174
-
175
-
176
-
177
-
178
-
179
-
180
-
181
-
182
-
183
-
184
-
185
-
186
-
187
-
188
-
189
-
190
-
191
-
 192
192 -
 193
193 -
 194
194 -
 195
195 -
 196
196 -
 197
197 -
 198
198 -
 199
199 -
 200
200 -
 201
201 -
 202
202 -
 203
203 -
 204
204 -
 205
205 -
 206
206 -
 207
207 -
 208
208 -
 209
209 -
 210
210 -
 211
211 -
 212
212 -
213
-
214
-
215
-
216
-
217
-
218
-
219
-
220
-
221
-
222
-
223
-
224
-
225
-
226
-
227
-
228
 |
 |

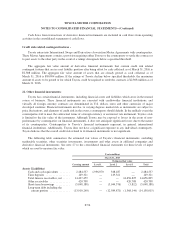
TOYOTA MOTOR CORPORATION
NOTES TO CONSOLIDATED FINANCIAL STATEMENTS—(Continued)
segment consists primarily of financing, and vehicle and equipment leasing operations to assist in the
merchandising of the parent company and its affiliated companies products as well as other products. The All
Other segment includes the design, manufacturing and sales of housing, telecommunications and other
businesses.
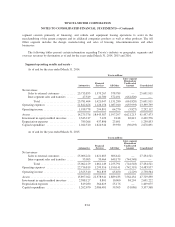
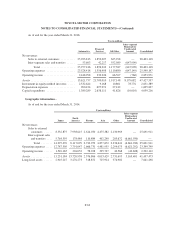
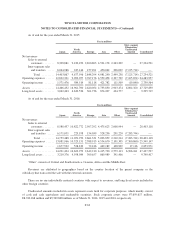
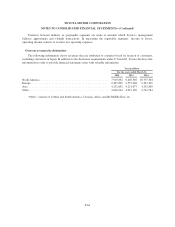
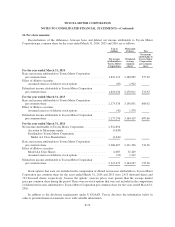
The following tables present certain information regarding Toyota’s industry or geographic segments and
overseas revenues by destination as of and for the years ended March 31, 2014, 2015 and 2016.
Segment operating results and assets -
As of and for the year ended March 31, 2014:
Yen in millions
Automotive
Financial
Services All Other
Inter-segment
Elimination/
Unallocated
Amount Consolidated
Net revenues
Sales to external customers .......... 23,733,855 1,379,267 578,789 — 25,691,911
Inter-segment sales and transfers ...... 47,549 41,780 572,491 (661,820) —
Total ........................ 23,781,404 1,421,047 1,151,280 (661,820) 25,691,911
Operating expenses .................... 21,842,626 1,126,156 1,087,010 (655,993) 23,399,799
Operating income ...................... 1,938,778 294,891 64,270 (5,827) 2,292,112
Assets ............................... 14,275,376 18,943,587 1,597,297 6,621,213 41,437,473
Investment in equity method investees ..... 2,343,217 7,129 9,418 69,812 2,429,576
Depreciation expenses .................. 789,266 437,896 23,691 — 1,250,853
Capital expenditure .................... 1,044,510 1,624,944 39,930 (30,693) 2,678,691
As of and for the year ended March 31, 2015:
Yen in millions
Automotive
Financial
Services All Other
Inter-segment
Elimination/
Unallocated
Amount Consolidated
Net revenues
Sales to external customers .......... 25,006,224 1,621,685 606,612 — 27,234,521
Inter-segment sales and transfers ...... 55,905 39,464 649,179 (744,548) —
Total ........................ 25,062,129 1,661,149 1,255,791 (744,548) 27,234,521
Operating expenses .................... 22,736,819 1,299,316 1,190,141 (742,319) 24,483,957
Operating income ...................... 2,325,310 361,833 65,650 (2,229) 2,750,564
Assets ............................... 15,897,022 22,378,941 1,889,433 7,564,434 47,729,830
Investment in equity method investees ..... 2,588,127 8,801 10,000 84,294 2,691,222
Depreciation expenses .................. 819,280 564,619 25,176 — 1,409,075
Capital expenditure .................... 1,262,670 2,086,481 39,503 (31,086) 3,357,568
F-61