Toyota 2015 Annual Report Download - page 22
Download and view the complete annual report
Please find page 22 of the 2015 Toyota annual report below. You can navigate through the pages in the report by either clicking on the pages listed below, or by using the keyword search tool below to find specific information within the annual report.-
 1
1 -
2
-
3
-
4
-
5
-
6
-
7
-
8
-
9
-
10
-
11
-
 12
12 -
 13
13 -
 14
14 -
 15
15 -
 16
16 -
 17
17 -
 18
18 -
 19
19 -
 20
20 -
 21
21 -
 22
22 -
 23
23 -
 24
24 -
 25
25 -
 26
26 -
 27
27 -
 28
28 -
 29
29 -
 30
30 -
 31
31 -
 32
32 -
33
-
34
-
35
-
36
-
37
-
38
-
39
-
40
-
41
-
42
-
43
-
44
-
45
-
46
-
47
-
48
-
49
-
50
-
51
-
52
-
53
-
54
-
55
-
56
-
57
-
58
-
59
-
60
-
61
-
62
-
63
-
64
-
65
-
66
-
67
-
68
-
69
-
70
-
71
-
72
-
73
-
74
-
75
-
76
-
77
-
78
-
79
-
80
-
81
-
82
-
83
-
84
-
85
-
86
-
87
-
88
-
89
-
90
-
91
-
92
-
93
-
94
-
95
-
96
-
97
-
98
-
99
-
100
-
101
-
102
-
103
-
104
-
105
-
106
-
107
-
108
-
109
-
110
-
111
-
112
-
113
-
114
-
115
-
116
-
117
-
118
-
119
-
120
-
121
-
122
-
123
-
124
-
125
-
126
-
127
-
128
-
129
-
130
-
131
-
132
-
133
-
134
-
135
-
136
-
137
-
138
-
139
-
140
-
141
-
142
-
143
-
144
-
145
-
146
-
147
-
148
-
149
-
150
-
151
-
152
-
153
-
154
-
155
-
156
-
157
-
158
-
159
-
160
-
161
-
162
-
163
-
164
-
165
-
166
-
167
-
168
-
169
-
170
-
171
-
172
-
173
-
174
-
175
-
176
-
177
-
178
-
179
-
180
-
181
-
182
-
183
-
184
-
185
-
186
-
187
-
188
-
189
-
190
-
191
-
192
-
193
-
194
-
195
-
196
-
197
-
198
-
199
-
200
-
201
-
202
-
203
-
204
-
205
-
206
-
207
-
208
-
209
-
210
-
211
-
212
-
213
-
214
-
215
-
216
-
217
-
218
-
219
-
220
-
221
-
222
-
223
-
224
-
225
-
226
-
227
-
228
 |
 |

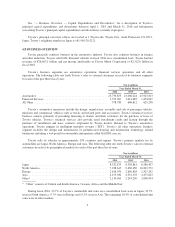
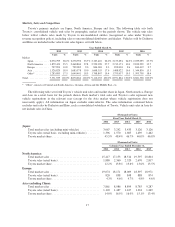
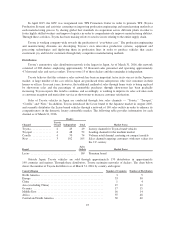
Markets, Sales and Competition
Toyota’s primary markets are Japan, North America, Europe and Asia. The following table sets forth
Toyota’s consolidated vehicle unit sales by geographic market for the periods shown. The vehicle unit sales
below reflect vehicle sales made by Toyota to unconsolidated entities (recognized as sales under Toyota’s
revenue recognition policy), including sales to unconsolidated distributors and dealers. Vehicles sold by Daihatsu
and Hino are included in the vehicle unit sales figures set forth below.
Year Ended March 31,
2012 2013 2014 2015 2016
Units % Units % Units % Units % Units %
Market
Japan ........... 2,070,799 28.2% 2,278,796 25.7% 2,365,410 26.0% 2,153,694 24.0% 2,059,093 23.7%
North America .... 1,872,423 25.5 2,468,804 27.8 2,529,398 27.7 2,715,173 30.3 2,839,229 32.7
Europe .......... 797,993 10.8 799,085 9.0 844,003 9.3 859,038 9.6 844,412 9.7
Asia ............ 1,326,829 18.0 1,683,578 19.0 1,608,355 17.6 1,488,922 16.6 1,344,836 15.5
Other* .......... 1,283,885 17.5 1,640,401 18.5 1,768,867 19.4 1,755,037 19.5 1,593,758 18.4
Total ................ 7,351,929 100.0% 8,870,664 100.0% 9,116,033 100.0% 8,971,864 100.0% 8,681,328 100.0%
* “Other” consists of Central and South America, Oceania, Africa and the Middle East, etc.
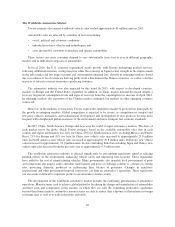
The following table sets forth Toyota’s vehicle unit sales and market share in Japan, North America, Europe
and Asia on a retail basis for the periods shown. Each market’s total sales and Toyota’s sales represent new
vehicle registrations in the relevant year (except for the Asia market where vehicle registration does not
necessarily apply). All information on Japan excludes mini-vehicles. The sales information contained below
excludes unit sales by Daihatsu and Hino, each a consolidated subsidiary of Toyota. Vehicle unit sales in Asia do
not include sales in China.
(Thousands of Units)
Fiscal Year Ended March 31,
2012 2013 2014 2015 2016
Japan:
Total market sales (excluding mini-vehicles) ............. 3,067 3,242 3,433 3,126 3,126
Toyota sales (retail basis, excluding mini-vehicles) ........ 1,396 1,570 1,605 1,439 1,462
Toyota market share ................................. 45.5% 48.4% 46.7% 46.0% 46.8%
(Thousands of Units)
Calendar Year Ended December 31,
2011 2012 2013 2014 2015
North America:
Total market sales ................................... 15,417 17,153 18,514 19,597 20,804
Toyota sales (retail basis) ............................. 1,880 2,360 2,520 2,670 2,817
Toyota market share ................................. 12.2% 13.8% 13.6% 13.6% 13.5%
Europe:
Total market sales ................................... 19,074 18,171 18,009 18,397 18,971
Toyota sales (retail basis) ............................. 820 838 848 888 874
Toyota market share ................................. 4.3% 4.6% 4.7% 4.8% 4.6%
Asia (excluding China):
Total market sales ................................... 7,861 8,986 8,899 8,785 9,287
Toyota sales (retail basis) ............................. 1,103 1,487 1,427 1,324 1,249
Toyota market share ................................. 14.0% 16.5% 16.0% 15.1% 13.4%
17