Toyota 2015 Annual Report Download - page 83
Download and view the complete annual report
Please find page 83 of the 2015 Toyota annual report below. You can navigate through the pages in the report by either clicking on the pages listed below, or by using the keyword search tool below to find specific information within the annual report.-
 1
1 -
2
-
3
-
4
-
5
-
6
-
7
-
8
-
9
-
10
-
11
-
12
-
13
-
14
-
15
-
16
-
17
-
18
-
19
-
20
-
21
-
22
-
23
-
24
-
25
-
26
-
27
-
28
-
29
-
30
-
31
-
32
-
33
-
34
-
35
-
36
-
37
-
38
-
39
-
40
-
41
-
42
-
43
-
44
-
45
-
46
-
47
-
48
-
49
-
50
-
51
-
52
-
53
-
54
-
55
-
56
-
57
-
58
-
59
-
60
-
61
-
62
-
63
-
64
-
65
-
66
-
67
-
68
-
69
-
70
-
71
-
72
-
 73
73 -
 74
74 -
 75
75 -
 76
76 -
 77
77 -
 78
78 -
 79
79 -
 80
80 -
 81
81 -
 82
82 -
 83
83 -
 84
84 -
 85
85 -
 86
86 -
 87
87 -
 88
88 -
 89
89 -
 90
90 -
 91
91 -
 92
92 -
 93
93 -
94
-
95
-
96
-
97
-
98
-
99
-
100
-
101
-
102
-
103
-
104
-
105
-
106
-
107
-
108
-
109
-
110
-
111
-
112
-
113
-
114
-
115
-
116
-
117
-
118
-
119
-
120
-
121
-
122
-
123
-
124
-
125
-
126
-
127
-
128
-
129
-
130
-
131
-
132
-
133
-
134
-
135
-
136
-
137
-
138
-
139
-
140
-
141
-
142
-
143
-
144
-
145
-
146
-
147
-
148
-
149
-
150
-
151
-
152
-
153
-
154
-
155
-
156
-
157
-
158
-
159
-
160
-
161
-
162
-
163
-
164
-
165
-
166
-
167
-
168
-
169
-
170
-
171
-
172
-
173
-
174
-
175
-
176
-
177
-
178
-
179
-
180
-
181
-
182
-
183
-
184
-
185
-
186
-
187
-
188
-
189
-
190
-
191
-
192
-
193
-
194
-
195
-
196
-
197
-
198
-
199
-
200
-
201
-
202
-
203
-
204
-
205
-
206
-
207
-
208
-
209
-
210
-
211
-
212
-
213
-
214
-
215
-
216
-
217
-
218
-
219
-
220
-
221
-
222
-
223
-
224
-
225
-
226
-
227
-
228
 |
 |
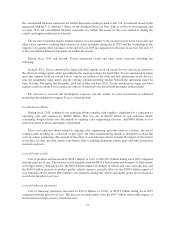
Interest expense increased by ¥3.2 billion, or 16.5%, to ¥22.8 billion during fiscal 2015 compared with the
prior fiscal year.
Foreign exchange gain, net increased by ¥37.8 billion, or 75.4%, to ¥88.1 billion during fiscal 2015
compared with the prior fiscal year. Foreign exchange gains and losses include the differences between the value
of foreign currency denominated assets and liabilities recognized through transactions in foreign currencies
translated at prevailing exchange rates and the value at the date the transaction settled during the fiscal year,
including those settled using forward foreign currency exchange contracts, or the value translated by appropriate
year-end exchange rates. The ¥37.8 billion increase in foreign exchange gain, net was due mainly to the gains
recorded in fiscal 2015 resulting from the Japanese yen being weaker against foreign currencies at the dates of
settlement of the foreign currency trade accounts receivable than at the dates of the transactions.
Other income (loss), net decreased by ¥73.0 billion to a loss of ¥70.1 billion during fiscal 2015 compared
with the prior fiscal year. The decrease was due mainly to the effect of the reissuance of treasury stock for
Toyota Mobility Foundation, a General Incorporated Foundation. See note 17 to the consolidated financial
statements for further discussion.
Income Taxes
The provision for income taxes increased by ¥125.6 billion, or 16.4%, to ¥893.4 billion during fiscal 2015
compared with the prior fiscal year due mainly to the increase in income before income taxes and equity in
earnings of affiliated companies. The effective tax rate for fiscal 2015 was 30.9%, which was lower than the
statutory tax rate in Japan. This was due mainly to the increase in tax credits and the effect of foreign subsidiaries
where statutory tax rates are lower than that of Japan.
Net Income Attributable to Noncontrolling Interests and Equity in Earnings of Affiliated Companies
Net income attributable to noncontrolling interests decreased by ¥33.9 billion, or 20.2%, to ¥134.5 billion
during fiscal 2015 compared with the prior fiscal year. This was due mainly to a decrease during fiscal 2015 in
net income attributable to the shareholders of consolidated subsidiaries.
Equity in earnings of affiliated companies during fiscal 2015 decreased by ¥9.8 billion, or 3.1%, to
¥308.5 billion compared with the prior fiscal year. This decrease was due mainly to a decrease during fiscal 2015
in net income attributable to the shareholders of affiliated companies accounted for by the equity method.
Net Income Attributable to Toyota Motor Corporation
Net income attributable to the shareholders of Toyota Motor Corporation increased by ¥350.2 billion, or
19.2%, to ¥2,173.3 billion during fiscal 2015 compared with the prior fiscal year.
Other Comprehensive Income and Loss
Other comprehensive income increased by ¥65.1 billion, or 7.4%, to ¥949.3 billion for fiscal 2015 compared
with the prior fiscal year. This increase resulted from unrealized holding gains on securities in fiscal 2015 of
¥567.0 billion compared with gains of ¥493.7 billion in the prior fiscal year due mainly to an increase in prices of
marketable securities in stock exchange markets in Japan, and from favorable foreign currency translation
adjustments gains of ¥380.4 billion in fiscal 2015 compared with gains of ¥296.9 billion in the prior fiscal year
due mainly to depreciation of the yen against the U.S. dollar, partially offset by pension liability adjustments in
fiscal 2015 of ¥1.9 billion compared with gains of ¥93.5 billion in the prior fiscal year.
78