Sara Lee 2008 Annual Report Download - page 81
Download and view the complete annual report
Please find page 81 of the 2008 Sara Lee annual report below. You can navigate through the pages in the report by either clicking on the pages listed below, or by using the keyword search tool below to find specific information within the annual report.-
 1
1 -
2
-
3
-
4
-
5
-
6
-
7
-
8
-
9
-
10
-
11
-
12
-
13
-
14
-
15
-
16
-
17
-
18
-
19
-
20
-
21
-
22
-
23
-
24
-
25
-
26
-
27
-
28
-
29
-
30
-
31
-
32
-
33
-
34
-
35
-
36
-
37
-
38
-
39
-
40
-
41
-
42
-
43
-
44
-
45
-
46
-
47
-
48
-
49
-
50
-
51
-
52
-
53
-
54
-
55
-
56
-
57
-
58
-
59
-
60
-
61
-
62
-
63
-
64
-
65
-
66
-
67
-
68
-
69
-
70
-
 71
71 -
 72
72 -
 73
73 -
 74
74 -
 75
75 -
 76
76 -
 77
77 -
 78
78 -
 79
79 -
 80
80 -
 81
81 -
 82
82 -
 83
83 -
 84
84
 |
 |

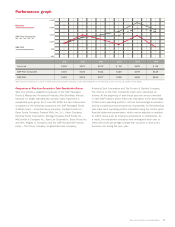
Comparison of Five-Year Cumulative Total Stockholder Return
Sara Lee utilizes a weighted composite of the S&P Packaged
Foods & Meats and Household Products (Non-Durables) Indices
because no single standardized industry index represents a
comparable peer group. As of June 28, 2008, the two indices were
comprised of the following companies: the S&P Packaged Foods
& Meats Index – Campbell Soup Company, ConAgra Foods Inc.,
Dean Foods Company, General Mills, Inc., H.J. Heinz Company,
Hershey Foods Corporation, Kellogg Company, Kraft Foods Inc.,
McCormick & Company Inc., Sara Lee Corporation, Tyson Foods Inc.
and Wm. Wrigley Jr. Company; and the S&P Household Products
Index – The Clorox Company, Colgate-Palmolive Company,
$100 invested on 06/30/03 in stock or index-including reinvestment of dividends. Fiscal year ending the closest Saturday to June 30 (June 28, 2008 for fiscal 2008).
Kimberly-Clark Corporation and The Procter & Gamble Company.
The returns on the Peer Composite index were calculated as
follows: At the beginning of each fiscal year the amount invested
in each S&P industry sector index was equivalent to the percentage
of Sara Lee’s operating profits in its food and beverage businesses
and its household products business, respectively, for the preceding
year. Sara Lee’s operating profit is calculated using the current year’s
financial statement presentation, which may be adjusted or restated
to reflect items such as business acquisitions or divestitures. As
a result, the investment allocation was re-weighted each year to
reflect the profit percentage change that occurred in Sara Lee’s
business mix during the prior year.
Sara Lee Corporation and Subsidiaries 79
Performance graph
$50
$75
$100
$125
$150
$175
Sara Lee $100 $113 $ 96 $125 $ 89
S&P Peer Composite
$100 $122 $125 $149 $138
S&P 500
$100 $127 $138 $166 $144
$127
$120
$119
S&P Peer Composite
Sara Lee
S&P 500
2003 2004 2005 2006 2007 2008