Sara Lee 2008 Annual Report Download - page 16
Download and view the complete annual report
Please find page 16 of the 2008 Sara Lee annual report below. You can navigate through the pages in the report by either clicking on the pages listed below, or by using the keyword search tool below to find specific information within the annual report.-
 1
1 -
2
-
3
-
4
-
5
-
 6
6 -
 7
7 -
 8
8 -
 9
9 -
 10
10 -
 11
11 -
 12
12 -
 13
13 -
 14
14 -
 15
15 -
 16
16 -
 17
17 -
 18
18 -
 19
19 -
 20
20 -
 21
21 -
 22
22 -
 23
23 -
 24
24 -
 25
25 -
 26
26 -
27
-
28
-
29
-
30
-
31
-
32
-
33
-
34
-
35
-
36
-
37
-
38
-
39
-
40
-
41
-
42
-
43
-
44
-
45
-
46
-
47
-
48
-
49
-
50
-
51
-
52
-
53
-
54
-
55
-
56
-
57
-
58
-
59
-
60
-
61
-
62
-
63
-
64
-
65
-
66
-
67
-
68
-
69
-
70
-
71
-
72
-
73
-
74
-
75
-
76
-
77
-
78
-
79
-
80
-
81
-
82
-
83
-
84
 |
 |

Financial review
14 Sara Lee Corporation and Subsidiaries
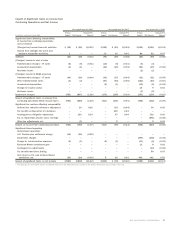
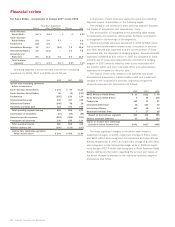
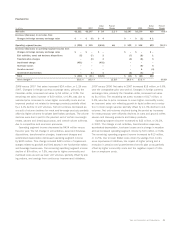
Review of Consolidated Results
The following tables summarize net sales and operating income for
2008 versus 2007 and 2007 versus 2006 and certain items that
affected the comparability of these amounts:
2008 versus 2007
Dollar Percent
In millions 2008 2007 Change Change
Net sales $13,212 $11,983 $1,229 10.3 %
Increase/(decrease) in
net sales from
Changes in currency rates $«÷÷÷÷– $÷÷(650) $«÷650
Acquisitions/dispositions 22–
Total $«÷÷÷÷2 $÷÷(648) $«÷650
Operating income $«÷÷260 $÷«÷562 $÷(302) (53.6) %
Increase/(decrease) in
operating income from
Contingent sale proceeds $«÷÷130 $÷«÷120 $«÷÷10
Changes in currency rates – (81) 81
Exit activities, asset and
business dispositions (38) (94) 56
Transformation charges (51) (119) 68
Accelerated depreciation (1) (32) 31
Impairment charges (851) (172) (679)
Acquisitions/dispositions (1) – (1)
Total $÷÷(812) $÷÷(378) $÷(434)
2007 versus 2006
Dollar Percent
In millions 2007 2006 Change Change
Net sales $11,983 $11,175 $808 7.2%
Increase/(decrease) in
net sales from
Changes in currency rates $«÷÷÷÷– $÷÷(316) $316
Acquisitions/dispositions 116 54 62
Total $«÷÷116 $÷÷(262) $378
Operating income $«÷÷562 $÷÷«416 $146 34.8%
Increase/(decrease) in
operating income from
Contingent sale proceeds $«÷÷120 $÷«÷114 $÷÷6
Changes in currency rates – (39) 39
Exit activities, asset and
business dispositions (94) (86) (8)
Transformation charges (119) (159) 40
Accelerated depreciation (32) (39) 7
Impairment charges (172) (193) 21
Hurricane losses –(5) 5
Change in vacation policy – 14 (14)
Acquisitions/dispositions 68(2)
Total $÷÷(291) $÷÷(385) $««94
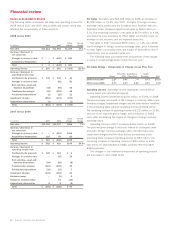
Net Sales Net sales were $13,212 million in 2008, an increase of
$1,229 million, or 10.3%, over 2007. Changes in foreign currency
exchange rates, particularly the European euro, Brazilian real and
Australian dollar, increased reported net sales by $650 million, or
5.7%. The remaining increase in net sales of $579 million, or 4.6%
was driven by price increases to offset higher commodity costs, an
increase in unit volumes, and an improved sales mix.
Net sales in 2007 increased $808 million, or 7.2%, over 2006,
due to changes in foreign currency exchange rates, price increases
to cover higher commodity costs, the impact of acquisitions net of
dispositions, and an improved sales mix.
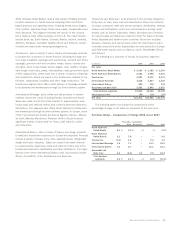
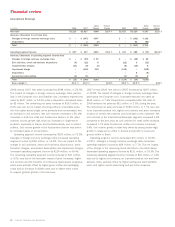
The following table summarizes the components of the change
in sales on a percentage basis versus the prior year:
Net Sales Bridge – Components of Change versus Prior Year
Price/Mix/ Acquisitions/ Foreign
Volume Other Dispositions Exchange Total
2008 versus 2007 1.2% 3.4% –% 5.7% 10.3%
2007 versus 2006 0.7% 3.1% 0.5% 2.9% 7.2%
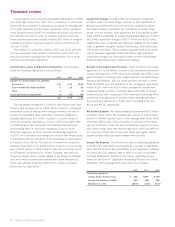
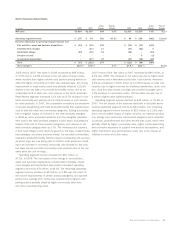
Operating Income Operating income represents income before
income taxes and net interest expense.
Operating income decreased by $302 million, or 53.6%, in 2008.
The year-over-year net impact of the changes in currency rates, trans-
formation charges, impairment charges and the other factors identified
in the preceding table reduced operating income by $434 million.
The remaining increase in operating income of $132 million, or 13.9%,
was due to an improved gross margin and a reduction in SG&A
costs after considering the impact of changes in foreign currency
exchange rates.
Operating income in 2007 increased $146 million, or 34.8%.
The year-over-year change in amounts related to contingent sales
proceeds, foreign currency exchange rates, transformation and
impairment charges and the other factors summarized in the
preceding table increased operating income by $94 million. The
remaining increase in operating income of $52 million, or 6.4%,
was due to an improved gross margin, partially offset by higher
SG&A expenses.
The changes in the individual components of operating income
are discussed in more detail below.