Sara Lee 2008 Annual Report Download - page 62
Download and view the complete annual report
Please find page 62 of the 2008 Sara Lee annual report below. You can navigate through the pages in the report by either clicking on the pages listed below, or by using the keyword search tool below to find specific information within the annual report.-
 1
1 -
2
-
3
-
4
-
5
-
6
-
7
-
8
-
9
-
10
-
11
-
12
-
13
-
14
-
15
-
16
-
17
-
18
-
19
-
20
-
21
-
22
-
23
-
24
-
25
-
26
-
27
-
28
-
29
-
30
-
31
-
32
-
33
-
34
-
35
-
36
-
37
-
38
-
39
-
40
-
41
-
42
-
43
-
44
-
45
-
46
-
47
-
48
-
49
-
50
-
51
-
 52
52 -
 53
53 -
 54
54 -
 55
55 -
 56
56 -
 57
57 -
 58
58 -
 59
59 -
 60
60 -
 61
61 -
 62
62 -
 63
63 -
 64
64 -
 65
65 -
 66
66 -
 67
67 -
 68
68 -
 69
69 -
 70
70 -
 71
71 -
 72
72 -
73
-
74
-
75
-
76
-
77
-
78
-
79
-
80
-
81
-
82
-
83
-
84
 |
 |

Notes to financial statements
Dollars in millions except per share data
Common stock dividends and dividend-per-share amounts declared
on outstanding shares of common stock were $298 and $0.42 in
2008, $368 and $0.50 in 2007 and $450 and $0.59 in 2006. The
corporation is incorporated in the state of Maryland and under those
laws repurchased shares are retired as repurchased.
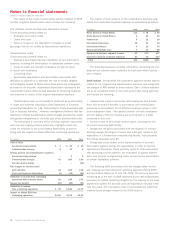
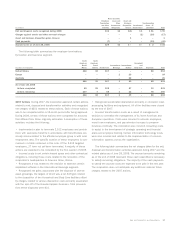
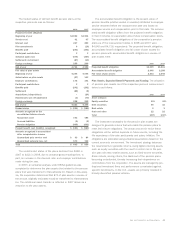
Note 7 – Accumulated Other Comprehensive Income
The components of accumulated other comprehensive income
are as follows:
Net
Unrealized
Gain (Loss) Accumulated
Cumulative on Qualifying Pension Other
Translation Cash Flow Liability Comprehensive
Adjustment Hedges Adjustment Income
Balance at July 2, 2005 $(731) $(14) $(816) $(1,561)
Other comprehensive
income (loss) activity 70 (28) 180 222
Balance at July 1, 2006 (661) (42) (636) (1,339)
Spin off of Hanesbrands, Inc. 5 4 58 67
Adjustment to apply
SAB No. 108 5–– 5
Adjustment to initially apply
SFAS No. 158 – – (168) (168)
Disposition of European
Meat business 229 – – 229
Other comprehensive
income (loss) activity 275 34 143 452
Balance at June 30, 2007 (147) (4) (603) (754)
Goodwill redenomination 106 – – 106
Disposition of Mexican
Meat business 31 – – 31
Amortization of net actuarial
loss and prior service credit – – 27 27
Net actuarial gain
arising during the period – – 165 165
Other comprehensive
income (loss) activity 549 25 – 574
Balance at June 28, 2008 $««539 $««21 $(411) $««««149
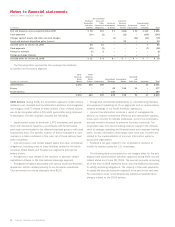
Note 8 – Stock-Based Compensation
The corporation has various stock option, employee stock purchase
and stock award plans. At June 28, 2008, 98.0 million shares were
available for future grant in the form of options, restricted shares
or stock appreciation rights out of 118.7 million shares originally
authorized.
Stock Options The exercise price of each stock option equals the
market price of the corporation’s stock on the date of grant. Options
can generally be exercised over a maximum term of 10 years. Options
granted up to and through 2006 generally vest ratably over three
years and expense is recognized in accordance with the provisions
of FASB Interpretation No. 28 (FIN 28). Options granted after 2006
cliff vest and expense is recognized on a straightline basis during
the vesting period. The fair value of each option grant is estimated
on the date of grant using the Black-Scholes option-pricing model
and the following weighted average assumptions:
2008 2007 2006
Weighted average
expected lives 8.0 years 6.1 years 6.1 years
Weighted average
risk-free interest rates 4.2% 4.8% 4.3%
Range of risk-free
interest rates 4.2% 4.7«–«4.9% 4.2«–«4.3%
Weighted average
expected volatility 24.3% 22.3% 26.2%
Range of
expected volatility 24.3% 21.5«–«22.4% 25.2«–«26.4%
Dividend yield 2.4% 2.8% 4.2%
The corporation uses historical volatility for a period of time
that is comparable to the expected life of the option to determine
volatility assumptions. In 2008 the corporation increased the
expected life of stock options to eight years. This estimate is
reasonable considering only senior executives receive stock options
and this group historically has held options for longer periods of
time compared to other employee groups.
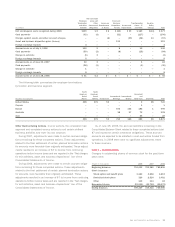
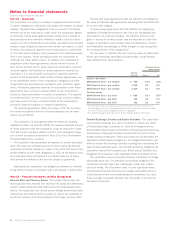
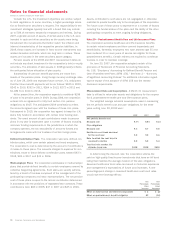
A summary of the changes in stock options outstanding under
the corporation’s option plans during 2008 is presented below:
Weighted
Weighted Average
Average Remaining Aggregate
Exercise Contractual Intrinsic
Shares in thousands Shares Price Term (Years) Value
Options outstanding
at June 30, 2007 42,994 $18.65 3.2 $21
Granted 1,322 16.49 – –
Exercised (312) 14.40 – –
Canceled/expired (12,073) 19.66 – –
Options outstanding
at June 28, 2008 31,931 $18.20 3.2 $««–
Options exercisable
at June 28, 2008 27,665 $18.61 2.4 $««–
At June 30, 2007 and July 1, 2006, the number of options
exercisable was 38,987 and 54,323, respectively, with weighted
average exercise prices of $18.98 and $18.99, respectively. The
weighted average grant date fair value of options granted during
2008, 2007 and 2006 was $4.36, $3.23 and $4.01, respectively.
The total intrinsic value of options exercised during 2008, 2007
and 2006 was $1, $5 and $2, respectively. The fair value of options
that vested during both 2008 and 2007 was $3. The corporation
received cash from the exercise of stock options during 2008 of
$4. As of June 28, 2008, the corporation had $4 of total unrecog-
nized compensation expense related to stock option plans that
will be recognized over the weighted average period of 1.02 years.
60 Sara Lee Corporation and Subsidiaries