Sara Lee 2008 Annual Report Download - page 22
Download and view the complete annual report
Please find page 22 of the 2008 Sara Lee annual report below. You can navigate through the pages in the report by either clicking on the pages listed below, or by using the keyword search tool below to find specific information within the annual report.-
 1
1 -
2
-
3
-
4
-
5
-
6
-
7
-
8
-
9
-
10
-
11
-
 12
12 -
 13
13 -
 14
14 -
 15
15 -
 16
16 -
 17
17 -
 18
18 -
 19
19 -
 20
20 -
 21
21 -
 22
22 -
 23
23 -
 24
24 -
 25
25 -
 26
26 -
 27
27 -
 28
28 -
 29
29 -
 30
30 -
 31
31 -
 32
32 -
33
-
34
-
35
-
36
-
37
-
38
-
39
-
40
-
41
-
42
-
43
-
44
-
45
-
46
-
47
-
48
-
49
-
50
-
51
-
52
-
53
-
54
-
55
-
56
-
57
-
58
-
59
-
60
-
61
-
62
-
63
-
64
-
65
-
66
-
67
-
68
-
69
-
70
-
71
-
72
-
73
-
74
-
75
-
76
-
77
-
78
-
79
-
80
-
81
-
82
-
83
-
84
 |
 |

Financial review
20 Sara Lee Corporation and Subsidiaries
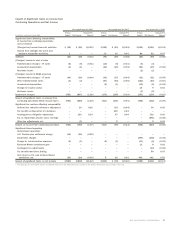
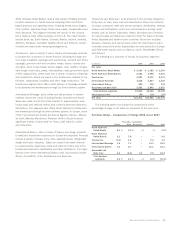
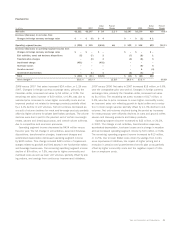
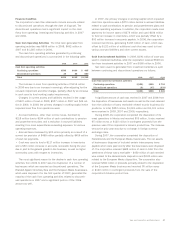
Net Sales Bridge – Components of Change 2007 versus 2006
Price/Mix/ Acquisitions/
Volume Other Dispositions Currency Total
North American
Retail Meats 3.6 % 0.6 % – % –% 4.2%
North American
Retail Bakery (3.9) 5.0 5.7 – 6.8
Foodservice (1.8) 2.6 – – 0.8
International Beverage 1.6 6.1 (2.5) 7.6 12.8
International Bakery 1.9 (1.1) – 7.0 7.8
Household and
Body Care 5.6 (0.1) 0.4 5.9 11.8
Total business
segments 0.7 % 3.1 % 0.5 % 2.9% 7.2%
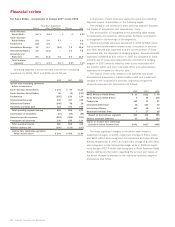
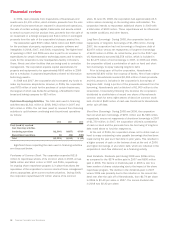
Operating segment income and total income from continuing
operations for 2008, 2007 and 2006 are as follows:
In millions 2008 2007 2006
Income from continuing operations
before income taxes
North American Retail Meats $«175 $«««94 $«136
North American Retail Bakery 55 (2) (197)
Foodservice (295) 139 116
International Beverage 547 317 388
International Bakery (346) 38 20
Household and Body Care 315 272 216
Total operating segment income 451 858 679
Amortization of intangibles (67) (64) (58)
General corporate expenses (254) (352) (319)
Contingent sale proceeds 130 120 114
Total operating income 260 562 416
Interest expense, net (100) (133) (227)
Income from continuing operations
before income taxes $«160 $«429 $«189
A discussion of each business segment’s sales and operating
segment income is presented on the following pages.
The change in unit volumes for each business segment excludes
the impact of acquisitions and dispositions, if any.
The amortization of intangibles in the preceding table relates
to trademarks and customer relationships. Software amortization
is recognized in the earnings of the segments.
General corporate expenses decreased in 2008 by $98 million
due to lower transformation related costs, a reduction in pension
and other benefit plan expenses and the non-recurrence of costs
associated with the corporation’s hedging program. General corporate
expenses increased by $33 million in 2007 as compared to 2006
primarily due to costs associated with the corporation’s hedging
program in 2007 partially offset by lower costs associated with
the transformation and lower corporate office and administrative
expenses as compared to the prior year.
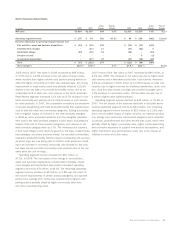
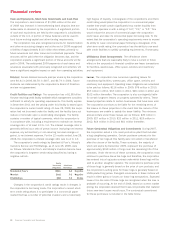
The impact of the costs related to exit activities and asset
and business dispositions, transformation costs and impairment
charges on the corporation’s business segments and general
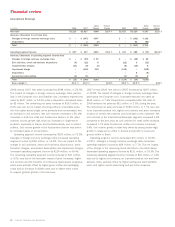
corporate expenses are summarized as follows:
In millions 2008 2007 2006
North American Retail Meats $÷33 $112 $÷48
North American Retail Bakery 4 48 208
Foodservice 436 11 21
International Beverage 15 139 16
International Bakery 409 18 44
Household and Body Care 71728
Impact on the business segments 904 345 365
General corporate expenses 37 72 103
Impact on income from continuing
operations before income taxes $941 $417 $468
The most significant charges in the above table relate to
impairment charges. In 2008, impairment charges of $431 million
and $400 million were recognized in Foodservice and International
Bakery, respectively. In 2007, an impairment charge of $118 million
was recognized in International Beverage, while in 2006 an impair-
ment charge of $179 million was recognized in North American Retail
Bakery. Additional information regarding the amount and nature of
the above charges is provided in the individual business segment
discussions that follow.