Sara Lee 2008 Annual Report Download - page 26
Download and view the complete annual report
Please find page 26 of the 2008 Sara Lee annual report below. You can navigate through the pages in the report by either clicking on the pages listed below, or by using the keyword search tool below to find specific information within the annual report.-
 1
1 -
2
-
3
-
4
-
5
-
6
-
7
-
8
-
9
-
10
-
11
-
12
-
13
-
14
-
15
-
 16
16 -
 17
17 -
 18
18 -
 19
19 -
 20
20 -
 21
21 -
 22
22 -
 23
23 -
 24
24 -
 25
25 -
 26
26 -
 27
27 -
 28
28 -
 29
29 -
 30
30 -
 31
31 -
 32
32 -
 33
33 -
 34
34 -
 35
35 -
 36
36 -
37
-
38
-
39
-
40
-
41
-
42
-
43
-
44
-
45
-
46
-
47
-
48
-
49
-
50
-
51
-
52
-
53
-
54
-
55
-
56
-
57
-
58
-
59
-
60
-
61
-
62
-
63
-
64
-
65
-
66
-
67
-
68
-
69
-
70
-
71
-
72
-
73
-
74
-
75
-
76
-
77
-
78
-
79
-
80
-
81
-
82
-
83
-
84
 |
 |

Financial review
24 Sara Lee Corporation and Subsidiaries
2008 versus 2007
Net sales increased by $598 million, or 22.9%.
The impact of changes in foreign currency exchange rates, particu-
larly in the European euro and Brazilian real, increased reported net
sales by $347 million, or 14.3%, while a disposition decreased sales
by $2 million. The remaining net sales increase of $253 million, or
8.6%, was due to the impact of pricing actions, a favorable sales
mix into higher priced single serve products and concentrates, and
an increase in unit volumes. Net unit volumes increased 1.5% with
increases in both the retail and foodservice sectors. In the retail
channel, volume growth was driven by increases in single-serve
products, especially in France and the Netherlands, and in instant
coffees. Unit volume growth in the foodservice channel was driven
by increased sales of concentrates.
Operating segment income increased by $230 million, or 72.8%.
Changes in foreign currency exchange rates increased operating
segment income by $59 million, or 14.2%. The net impact of the
change in exit activities, asset and business dispositions, trans-
formation charges, accelerated depreciation and impairment charges
increased operating segment income by $124 million, or 49.4%.
The remaining operating segment income increase of $47 million,
or 9.2%, was due to the favorable impact of price increases, higher
unit volumes and the benefits of continuous improvement programs,
which were partially offset by higher green coffee and packaging
costs and an increase in SG&A costs due to higher labor costs
to support general growth in the business.
2007 versus 2006
Net sales in 2007 increased by $297 million,
or 12.8%. The impact of changes in foreign currency exchange rates,
particularly the European euro, increased reported net sales by
$162 million, or 7.6%. Dispositions completed after the start of
2006 reduced net sales by $51 million, or 2.5%, during the year.
The remaining net sales increase of $186 million, or 7.7%, was due
to an improved product mix, higher unit volumes and price increases
to pass on certain raw material cost increases to the customer. Net
unit volumes in the International Beverage segment increased 1.6%
compared to the prior year, as unit volumes for retail coffee products
increased 1.7% while foodservice coffee unit volumes increased
0.4%. Unit volume growth in retail was driven by strong double digit
growth in single-serve coffee in Europe and growth in roast and
ground coffee in Brazil.
Operating segment income decreased $71 million, or 18.4%,
in 2007. Changes in foreign currency exchange rates increased
operating segment income by $28 million, or 7.7%. The net impact
of the change in the remaining items identified in the table above
decreased operating segment income by $131 million, or 33.5%. The
remaining operating segment income increase of $32 million, or 7.4%,
was due to higher unit volumes, an improved product mix and lower
pension costs, partially offset by higher selling and administrative
costs and higher media advertising and promotion expense.
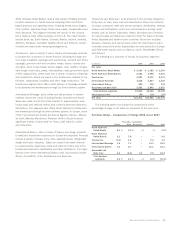
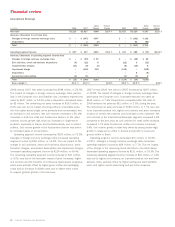
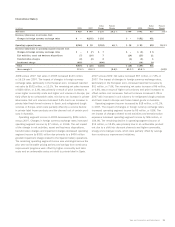
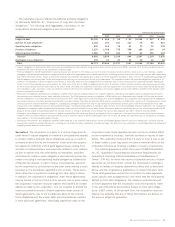
International Beverage
Dollar Percent Dollar Percent
In millions 2008 2007 Change Change 2007 2006 Change Change
Net sales $3,215 $2,617 $598 22.9 % $2,617 $2,320 $«297 12.8 %
Increase/(decrease) in net sales from
Changes in foreign currency exchange rates $÷÷÷«– $÷(347) $347 $÷÷÷«– $÷(162) $«162
Dispositions – 2 (2) – 51 (51)
Total $÷÷÷«– $÷(345) $345 $÷÷÷«– $÷(111) $«111
Operating segment income $÷«547 $÷«317 $230 72.8 % $÷«317 $÷«388 $««(71) (18.4) %
Increase/(decrease) in operating segment income from
Changes in foreign currency exchange rates $÷÷÷«– $÷÷(59) $÷59 $÷÷÷«– $÷÷(28) $÷«28
Exit activities, asset and business dispositions (4) (12) 8 (12) 3 (15)
Transformation charges (10) (8) (2) (8) (16) 8
Impairment charge – (118) 118 (118) – (118)
Dispositions ––– –8(8)
Accelerated depreciation (1) (1) – (1) (3) 2
Total $÷÷(15) $÷(198) $183 $÷(139) $÷÷(36) $(103)
Gross margin % 41.4 % 43.0 % (1.6) % 43.0 % 43.5 % (0.5) %