Sara Lee 2008 Annual Report Download - page 73
Download and view the complete annual report
Please find page 73 of the 2008 Sara Lee annual report below. You can navigate through the pages in the report by either clicking on the pages listed below, or by using the keyword search tool below to find specific information within the annual report.-
 1
1 -
2
-
3
-
4
-
5
-
6
-
7
-
8
-
9
-
10
-
11
-
12
-
13
-
14
-
15
-
16
-
17
-
18
-
19
-
20
-
21
-
22
-
23
-
24
-
25
-
26
-
27
-
28
-
29
-
30
-
31
-
32
-
33
-
34
-
35
-
36
-
37
-
38
-
39
-
40
-
41
-
42
-
43
-
44
-
45
-
46
-
47
-
48
-
49
-
50
-
51
-
52
-
53
-
54
-
55
-
56
-
57
-
58
-
59
-
60
-
61
-
62
-
 63
63 -
 64
64 -
 65
65 -
 66
66 -
 67
67 -
 68
68 -
 69
69 -
 70
70 -
 71
71 -
 72
72 -
 73
73 -
 74
74 -
 75
75 -
 76
76 -
 77
77 -
 78
78 -
 79
79 -
 80
80 -
 81
81 -
 82
82 -
 83
83 -
84
 |
 |

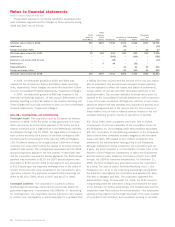
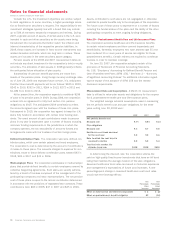
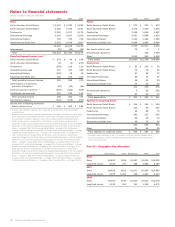
Net Periodic Benefit Cost and Funded Status The components of
the net periodic benefit cost and curtailment gains associated with
continuing operations were as follows:
2008 2007 2006
Components of defined benefit
net periodic cost
Service cost $÷«8 $÷«8 $÷«8
Interest cost 16 13 14
Net amortization and deferral (18) (22) (20)
Net periodic benefit cost (income) $÷«6 $÷(1) $÷«2
Curtailment gains $÷«– $÷(2) $÷(7)
The amount of the prior service credits, net actuarial loss and
net initial asset that is expected to be amortized from accumulated
other comprehensive income and reported as a component of net
periodic benefit cost during 2009 is $23 of income, $3 of expense
and $2 of income, respectively.
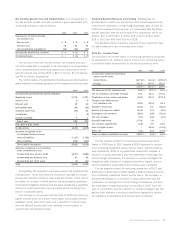
The funded status of postretirement health-care and life-insurance
plans related to continuing operations at the respective year-ends were:
2008 2007
Accumulated postretirement benefit obligation
Beginning of year $«279 $«227
Service cost 88
Interest cost 16 13
Net benefits paid (19) (19)
Actuarial (gain) loss (39) 52
Curtailment –(5)
Foreign exchange 73
End of year 252 279
Fair value of plan assets 11
Funded status $(251) $(278)
Amounts recognized on the
consolidated balance sheets
Accrued liabilities $÷(17) $÷(18)
Other liabilities (234) (260)
Total liability recognized $(251) $(278)
Amounts recognized in accumulated
other comprehensive loss
Unamortized prior service credit $(167) $(186)
Unamortized net actuarial loss 37 86
Unamortized net initial asset (9) (11)
Total $(139) $(111)
During 2006, the corporation amended several of its postretirement
medical plans. These amendments eliminated coverage for certain
groups and required retirees to bear a greater portion of the cost of
the plans. As a result of these actions, the accumulated postretire-
ment benefit obligation declined and the plans recognized a significant
amount of unamortized prior service credits which are being amor-
tized in subsequent years.
The increase in net periodic benefit costs in 2008 was driven by
higher interest costs as a result of the higher accumulated benefit
obligation at the start of the year, and a reduction in net amortiza-
tion and deferral income due to an increase in amortization of
unamortized net actuarial losses.
Expected Benefit Payments and Funding Substantially all
postretirement health-care and life-insurance benefit payments are
made by the corporation. Using foreign exchange rates at June 30,
2008 and expected future service, it is anticipated that the future
benefit payments that will be funded by the corporation will be as
follows: $17 in 2009, $17 in 2010, $18 in 2011, $18 in 2012,
$18 in 2013 and $90 from 2014 to 2018.
The Medicare Part D subsidies received by the corporation have
not been material in any of the past three years.
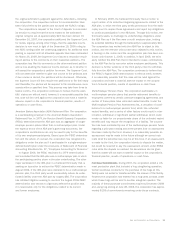
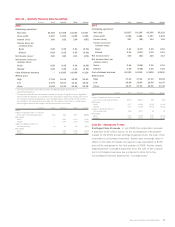
Note 21 – Income Taxes
The provisions for income taxes on continuing operations computed
by applying the U.S. statutory rate to income from continuing opera-
tions before taxes as reconciled to the actual provisions were:
2008 2007 2006
Income from continuing operations
before income taxes
United States (347.5) % (44.4) % (255.3) %
Foreign 447.5 144.4 355.3
100.0 % 100.0 % 100.0 %
Tax expense at U.S. statutory rate 35.0 % 35.0 % 35.0 %
Tax on remittance of foreign earnings 74.0 42.4 279.2
Finalization of tax reviews and audits (59.9) (25.7) (175.2)
Foreign taxes different than
U.S. statutory rate (30.0) (13.4) 16.1
Valuation allowances (12.2) 6.1 (18.9)
Benefit of foreign tax credits (14.5) (7.2) (5.5)
Contingent sale proceeds (28.6) (9.8) (21.1)
Tax rate changes (0.1) (3.8) (2.4)
Goodwill impairment 173.5 7.8 –
Tax provision adjustments (8.5) 3.8 12.5
Sale of capital assets – (35.5) (14.6)
Other, net (3.1) (2.3) (21.5)
Taxes at effective worldwide tax rates 125.6 % (2.6) % 83.6 %
The tax expense related to continuing operations was $212
higher in 2008 than in 2007 despite a $269 decrease in income
from continuing operations before income taxes. The tax expense
was impacted by $790 of non-deductible impairment charges, a
reduction in costs associated with the repatriation of earnings from
certain foreign subsidiaries, the reduction in certain contingent tax
obligations after statutes in multiple jurisdictions lapsed, and cer-
tain tax regulatory examinations and reviews were completed.
The tax expense related to continuing operations in 2007 was
$169 lower in 2007 than in 2006 despite a $240 increase in income
from continuing operations before income taxes. The decrease is
primarily attributable to a reduction in costs associated with the
repatriation of earnings from certain foreign subsidiaries and from
the corporation recognizing certain tax benefits in 2007 from the
sale of a subsidiary and the reduction in certain contingent tax obli-
gations after statutes in multiple jurisdictions lapsed and certain
tax regulatory examinations and reviews were completed.
Sara Lee Corporation and Subsidiaries 71