Sara Lee 2008 Annual Report Download - page 27
Download and view the complete annual report
Please find page 27 of the 2008 Sara Lee annual report below. You can navigate through the pages in the report by either clicking on the pages listed below, or by using the keyword search tool below to find specific information within the annual report.-
 1
1 -
2
-
3
-
4
-
5
-
6
-
7
-
8
-
9
-
10
-
11
-
12
-
13
-
14
-
15
-
16
-
 17
17 -
 18
18 -
 19
19 -
 20
20 -
 21
21 -
 22
22 -
 23
23 -
 24
24 -
 25
25 -
 26
26 -
 27
27 -
 28
28 -
 29
29 -
 30
30 -
 31
31 -
 32
32 -
 33
33 -
 34
34 -
 35
35 -
 36
36 -
 37
37 -
38
-
39
-
40
-
41
-
42
-
43
-
44
-
45
-
46
-
47
-
48
-
49
-
50
-
51
-
52
-
53
-
54
-
55
-
56
-
57
-
58
-
59
-
60
-
61
-
62
-
63
-
64
-
65
-
66
-
67
-
68
-
69
-
70
-
71
-
72
-
73
-
74
-
75
-
76
-
77
-
78
-
79
-
80
-
81
-
82
-
83
-
84
 |
 |

Sara Lee Corporation and Subsidiaries 25
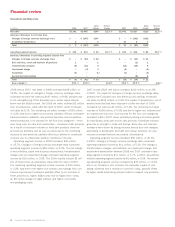
2008 versus 2007
Net sales in 2008 increased $130 million,
or 16.1% over 2007. The impact of changes in foreign currency
exchange rates, particularly in the European euro, increased reported
net sales by $102 million, or 13.1%. The remaining net sales increase
of $28 million, or 3.0%, was primarily a result of price increases to
cover higher commodity costs and higher unit volumes in Europe, par-
tially offset by an unfavorable sales mix due to an increase in private
label sales. Net unit volumes increased 0.3% due to an increase in
private label fresh bread volumes in Spain, and refrigerated dough
volumes in Europe, which were partially offset by a volume decline
in private label frozen products and the planned exit of certain prod-
ucts in Australia.
Operating segment income in 2008 decreased by $384 million
versus 2007. Changes in foreign currency exchange rates increased
operating segment income by $7 million, or 12.6%. The net impact
of the change in exit activities, asset and business dispositions,
transformation charges and impairment charges decreased operating
segment income by $391 million due primarily to a $400 million
goodwill impairment charge related to the Spanish bakery operations.
The remaining operating segment income was unchanged versus the
prior year as favorable pricing actions and savings from continuous
improvement programs were offset by higher commodity and labor
costs and an unfavorable sales mix shift to private label in Spain.
2007 versus 2006
Net sales increased $57 million, or 7.8%, in
2007. The impact of changes in foreign currency exchange rates,
particularly in the European euro, increased reported net sales by
$51 million, or 7.0%. The remaining net sales increase of $6 million,
or 0.8%, was a result of higher unit volumes and price increases to
offset certain cost increases. Net unit volumes increased 1.9% in
2007 with increases in unit volumes for refrigerated dough products
and fresh bread in Europe and frozen baked goods in Australia.
Operating segment income increased by $18 million, or 91.3%,
in 2007. The impact of changes in foreign currency exchange rates
increased operating segment income by $5 million, or 5.8%. The
net impact of changes related to exit activities and transformation
expenses increased operating segment income by $26 million, or
104.0%. The remaining decline in operating segment income of
$13 million, or 18.5%, was primarily due to an unfavorable product
mix due to a shift into discount channels and higher commodity,
energy and employee costs, which were partially offset by savings
from continuous improvement initiatives.
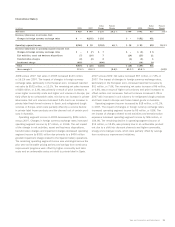
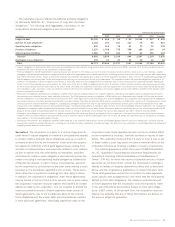
International Bakery
Dollar Percent Dollar Percent
In millions 2008 2007 Change Change 2007 2006 Change Change
Net sales $«929 $«799 $«130 16.1 % $799 $742 $57 7.8 %
Increase/(decrease) in net sales from
Changes in foreign currency exchange rates $÷÷«– $(102) $«102 $÷÷– $«(51) $51
Operating segment income $(346) $÷«38 $(384) NM % $÷38 $÷20 $18 91.3 %
Increase/(decrease) in operating segment income from
Changes in foreign currency exchange rates $÷÷«– $÷÷(7) $÷÷«7 $÷÷– $÷«(5) $÷5
Exit activities, asset and business dispositions (7) (14) 7 (14) (25) 11
Transformation charges (2) (4) 2 (4) (5) 1
Impairment charge (400) – (400) – (14) 14
Total $(409) $÷(25) $(384) $«(18) $«(49) $31
Gross margin % 37.6 % 40.0 % (2.4) % 40.0 % 41.8 % (1.8) %