Sara Lee 2008 Annual Report Download - page 25
Download and view the complete annual report
Please find page 25 of the 2008 Sara Lee annual report below. You can navigate through the pages in the report by either clicking on the pages listed below, or by using the keyword search tool below to find specific information within the annual report.-
 1
1 -
2
-
3
-
4
-
5
-
6
-
7
-
8
-
9
-
10
-
11
-
12
-
13
-
14
-
 15
15 -
 16
16 -
 17
17 -
 18
18 -
 19
19 -
 20
20 -
 21
21 -
 22
22 -
 23
23 -
 24
24 -
 25
25 -
 26
26 -
 27
27 -
 28
28 -
 29
29 -
 30
30 -
 31
31 -
 32
32 -
 33
33 -
 34
34 -
 35
35 -
36
-
37
-
38
-
39
-
40
-
41
-
42
-
43
-
44
-
45
-
46
-
47
-
48
-
49
-
50
-
51
-
52
-
53
-
54
-
55
-
56
-
57
-
58
-
59
-
60
-
61
-
62
-
63
-
64
-
65
-
66
-
67
-
68
-
69
-
70
-
71
-
72
-
73
-
74
-
75
-
76
-
77
-
78
-
79
-
80
-
81
-
82
-
83
-
84
 |
 |

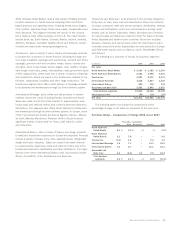
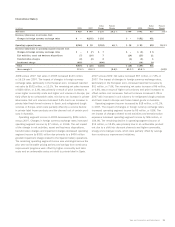
Sara Lee Corporation and Subsidiaries 23
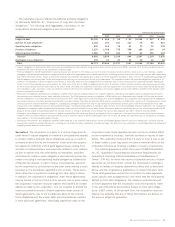
2008 versus 2007
Net sales increased $24 million, or 1.1% over
2007. Changes in foreign currency exchange rates, primarily the
Canadian dollar, increased net sales by $4 million, or 0.2%. The
remaining net sales increase of $20 million, or 0.9%, was due to
selected price increases to cover higher commodity costs and an
improved product mix related to beverage products partially offset
by a 3.1% decline in unit volumes. Net unit volumes decreased as
a result of volume declines for meat and beverage products partially
offset by higher volumes for private label bakery products. The volume
declines were due in part to the planned exit of certain low-margin
meats, sauces and dressing products, and overall volume softness
due to competitive and economic pressures.
Operating segment income decreased by $434 million versus
the prior year. The net change in exit activities, asset and business
dispositions, transformation charges, impairment charges and
accelerated depreciation decreased operating segment income
by $425 million. This change included $431 million of impairment
charges related to goodwill and fixed assets in the foodservice bakery
and beverage businesses. The remaining operating segment income
decline of $9 million, or 7.5%, was due to higher commodity and
overhead costs as well as lower unit volumes, partially offset by pric-
ing actions, and savings from continuous improvement initiatives.
2007 versus 2006
Net sales in 2007 increased $18 million, or 0.8%,
over the comparable prior year period. Changes in foreign currency
exchange rates, primarily the Canadian dollar, increased net sales
by $1 million. The remaining net sales increase of $17 million, or
0.8%, was due to price increases to cover higher commodity costs;
an improved sales mix reflecting growth in liquid coffee and a reduc-
tion in lower margin sauces; partially offset by a 1.8% decline in unit
volumes. Net unit volumes declined during the period as increases
for meat products were offset by declines in roast and ground coffee,
sauces and dressing products and bakery products.
Operating segment income increased by $23 million, or 20.2%,
in 2007. The change in exit activities, transformation expenses,
accelerated depreciation, hurricane losses and a change in vacation
accrual increased operating segment income by $10 million, or 8.6%.
The remaining operating segment income increased by $13 million,
or 11.5%, due to lower SG&A costs driven by savings from contin -
uous improvement initiatives, the impact of higher pricing and a
reduction in pension and postretirement benefit plan costs partially
offset by higher commodity costs and the negative impact of infla-
tion on employee costs.
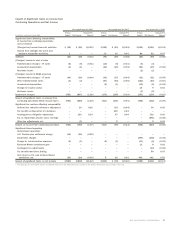
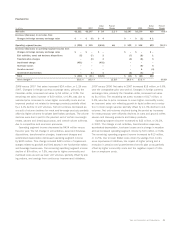
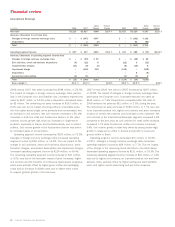
Foodservice
Dollar Percent Dollar Percent
In millions 2008 2007 Change Change 2007 2006 Change Change
Net sales $2,221 $2,197 $÷«24 1.1 % $2,197 $2,179 $18 0.8 %
Increase/(decrease) in net sales from
Changes in foreign currency exchange rates $÷÷÷«– $÷÷««(4) $÷÷«4 $÷÷÷«– $÷÷÷(1) $÷1
Operating segment income $÷(295) $÷«139 $(434) NM $÷«139 $÷«116 $23 20.2 %
Increase/(decrease) in operating segment income from
Changes in foreign currency exchange rates $÷÷÷«– $÷÷÷«– $÷÷«– $÷÷÷«– $÷÷÷«– $÷–
Exit activities, asset and business dispositions (5) (7) 2 (7) (8) 1
Transformation charges – (3) 3 (3) (8) 5
Impairment charge (431) – (431) – – –
Hurricane losses ––– –(5)5
Vacation accrual ––– –4(4)
Accelerated depreciation – (1) 1 (1) (4) 3
Total $÷(436) $÷÷(11) $(425) $÷÷(11) $÷÷(21) $10
Gross margin % 25.1 % 26.3 % (1.2) % 26.3 % 27.2 % (0.9) %