Sara Lee 2008 Annual Report Download - page 23
Download and view the complete annual report
Please find page 23 of the 2008 Sara Lee annual report below. You can navigate through the pages in the report by either clicking on the pages listed below, or by using the keyword search tool below to find specific information within the annual report.-
 1
1 -
2
-
3
-
4
-
5
-
6
-
7
-
8
-
9
-
10
-
11
-
12
-
 13
13 -
 14
14 -
 15
15 -
 16
16 -
 17
17 -
 18
18 -
 19
19 -
 20
20 -
 21
21 -
 22
22 -
 23
23 -
 24
24 -
 25
25 -
 26
26 -
 27
27 -
 28
28 -
 29
29 -
 30
30 -
 31
31 -
 32
32 -
 33
33 -
34
-
35
-
36
-
37
-
38
-
39
-
40
-
41
-
42
-
43
-
44
-
45
-
46
-
47
-
48
-
49
-
50
-
51
-
52
-
53
-
54
-
55
-
56
-
57
-
58
-
59
-
60
-
61
-
62
-
63
-
64
-
65
-
66
-
67
-
68
-
69
-
70
-
71
-
72
-
73
-
74
-
75
-
76
-
77
-
78
-
79
-
80
-
81
-
82
-
83
-
84
 |
 |

Sara Lee Corporation and Subsidiaries 21
2007 versus 2006
Net sales in 2007 increased by $96 million, or
4.2% over 2006. The increase in net sales was due to higher retail
unit volumes and a favorable product mix. Unit volumes increased
3.6% as compared to 2006, driven by a 4.0% increase in retail unit
volumes due to higher volumes for breakfast sandwiches, lunch com-
bos, ultra thin slice meats, hot dogs and smoked sausages and a
1.9% increase in commodity meats. The favorable mix was due to
a shift to higher value added products.
Operating segment income declined by $42 million, or 31.6%, in
2007. The net impact of the amounts identified in the table above
reduced operating segment income by $64 million. The remaining
operating segment income increase of $22 million, or 11.6%, was
due to the favorable impact of higher volumes, an improved product
mix, savings from continuous improvement programs and a reduction
in pension, postretirement and other benefit plan costs, which were
partially offset by higher commodity costs, higher media advertising
and promotion expenses to support new product introductions, and
higher distribution and administrative costs due to the impact of
inflation on labor and other costs.
2008 versus 2007
Net sales in 2008 increased by $69 million,
or 3.0%, due to a 6.5% increase in the net sales of retail meats,
which resulted from higher volumes and positive pricing actions to
offset the higher commodity and other raw material costs. The strong
improvement in retail meats sales was partially offset by a 32.6%
decline in the net sales of non-retail commodity meats, due to an
unfavorable shift in sales mix. Unit volumes in the North American
Retail Meats segment increased 2.1% with an 8.7% increase in non-
retail commodity unit volumes and a 0.6% increase in unit volumes
for retail products. In 2007, the corporation completed the shutdown
of its pork slaughtering and meat production facility that supplied prod-
ucts to both the retail and commodity categories. Exiting this facility
had a negative impact on volumes in the retail products category
in 2008 as some processed products from the slaughter operation
were sold in the retail products category in prior years. Excluding the
impact of the exit of these product categories, unit volumes in the
retail products category were up 3.7%. The increased unit volumes
in this retail category were driven by growth in hot dogs, cooked break-
fast sausages, and sliced luncheon meats. For non-retail commodities,
exiting the production facility had the impact of increasing unit volumes
as whole hogs are now being sold to another meat processor, result-
ing in an increase in non-retail commodity unit volumes for the year,
but lower overall non-retail commodity meat revenues due to the low
sales price per unit for hogs.
Operating segment income increased by $81 million, or
87.2%, in 2008. The net impact of the change in exit activities,
asset and business dispositions, transformation charges, impair-
ment charges and accelerated depreciation increased operating
segment income by $79 million, or 86.4%. The remaining operating
segment income increase of $2 million, or 0.8%, was the result of
the volume improvements in certain product categories, an improved
product mix, savings from continuous improvement programs and
pricing actions partially offset by higher commodity, labor, fuel
and other manufacturing costs.
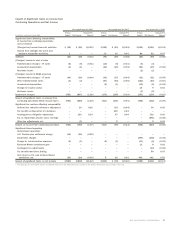
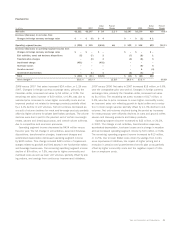
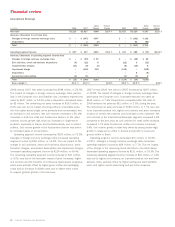
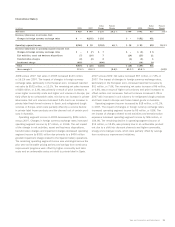
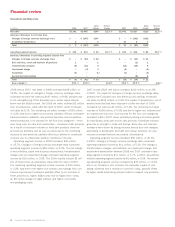
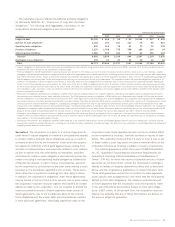
North American Retail Meats
Dollar Percent Dollar Percent
In millions 2008 2007 Change Change 2007 2006 Change Change
Net sales $2,424 $2,355 $69 3.0% $2,355 $2,259 $«96 4.2 %
Operating segment income $÷«175 $÷÷«94 $81 87.2% $÷÷«94 $÷«136 $(42) (31.6) %
Increase/(decrease) in operating segment income from
Exit activities, asset and business dispositions $÷÷(13) $÷÷(34) $21 $÷÷(34) $÷÷(15) $(19)
Transformation charges – (17) 17 (17) (21) 4
Impairment charge (20) (34) 14 (34) – (34)
Vacation accrual ––– –3(3)
Accelerated depreciation – (27) 27 (27) (15) (12)
Total $÷÷(33) $÷(112) $79 $÷(112) $÷÷(48) $(64)
Gross margin % 28.5 % 27.8 % 0.7% 27.8 % 28.2 % (0.4) %