Sara Lee 2008 Annual Report Download - page 76
Download and view the complete annual report
Please find page 76 of the 2008 Sara Lee annual report below. You can navigate through the pages in the report by either clicking on the pages listed below, or by using the keyword search tool below to find specific information within the annual report.-
 1
1 -
2
-
3
-
4
-
5
-
6
-
7
-
8
-
9
-
10
-
11
-
12
-
13
-
14
-
15
-
16
-
17
-
18
-
19
-
20
-
21
-
22
-
23
-
24
-
25
-
26
-
27
-
28
-
29
-
30
-
31
-
32
-
33
-
34
-
35
-
36
-
37
-
38
-
39
-
40
-
41
-
42
-
43
-
44
-
45
-
46
-
47
-
48
-
49
-
50
-
51
-
52
-
53
-
54
-
55
-
56
-
57
-
58
-
59
-
60
-
61
-
62
-
63
-
64
-
65
-
 66
66 -
 67
67 -
 68
68 -
 69
69 -
 70
70 -
 71
71 -
 72
72 -
 73
73 -
 74
74 -
 75
75 -
 76
76 -
 77
77 -
 78
78 -
 79
79 -
 80
80 -
 81
81 -
 82
82 -
 83
83 -
 84
84
 |
 |

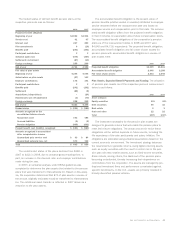
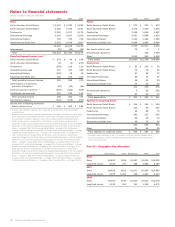
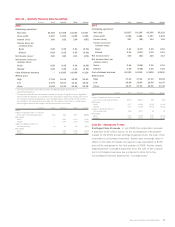
Notes to financial statements
Dollars in millions except per share data
2008 2007 2006
Sales1,2
North American Retail Meats $÷2,424 $÷2,355 $÷2,259
North American Retail Bakery 2,183 1,998 1,871
Foodservice 2,221 2,197 2,179
International Beverage 3,215 2,617 2,320
International Bakery 929 799 742
Household and Body Care 2,291 2,042 1,827
13,263 12,008 11,198
Intersegment (51) (25) (23)
Total $13,212 $11,983 $11,175
Operating Segment Income (Loss)3,4,5
North American Retail Meats $÷÷«175 $÷÷÷«94 $÷÷«136
North American Retail Bakery 55 (2) (197)
Foodservice (295) 139 116
International Beverage 547 317 388
International Bakery (346) 38 20
Household and Body Care 315 272 216
Total operating segment income 451 858 679
Amortization of trademarks
and other intangibles5(67) (64) (58)
General corporate expenses3,4,5 (254) (352) (319)
Contingent sale proceeds 130 120 114
Total operating income 260 562 416
Net interest expense (100) (133) (227)
Income from continuing operations
before income taxes $÷÷«160 $÷÷«429 $÷÷«189
1Includes sales between segments. Such sales are at transfer prices that are equivalent
to market value.
2Revenues from one customer represent approximately $1.3 billion, $1.3 billion and $1.2 billion
of the corporation’s consolidated revenues in 2008, 2007 and 2006, respectively. Each of
the corporation’s business segments sells to this customer, except International Bakery.
32008 includes amounts recognized for exit activities, asset and business dispositions,
impairment charges, transformation expenses and accelerated depreciation in the Consolidated
Statements of Income that impacted operating segment income by: North American Retail
Meats – a charge of $33; North American Retail Bakery – a charge of $4; Foodservice –
a charge of $436; International Beverage – a charge of $15; International Bakery – a charge
of $409; Household and Body Care – a charge of $7; Corporate Office – a charge of $37.
42007 includes amounts recognized for exit activities, asset and business dispositions,
impairment charges, transformation expenses and accelerated depreciation in the Consolidated
Statements of Income that impacted operating segment income by: North American Retail
Meats – a charge of $112; North American Retail Bakery – a charge of $48; Foodservice –
a charge of $11; International Beverage – a charge of $139; International Bakery – a charge
of $18; Household and Body Care – a charge of $17; Corporate Office – a charge of $72.
52006 includes amounts recognized for exit activities, asset and business dispositions,
impairment charges, transformation expenses and accelerated depreciation in the Consolidated
Statements of Income that impacted operating segment income by: North American Retail
Meats – a charge of $48; North American Retail Bakery – a charge of $208; Foodservice –
a charge of $21; International Beverage – a charge of $16; International Bakery – a charge
of $44; Household and Body Care – a charge of $28; Corporate Office – a charge of $103.
2008 2007 2006
Assets
North American Retail Meats $÷÷«975 $÷÷«929 $÷÷«879
North American Retail Bakery 1,172 1,129 1,149
Foodservice 1,138 1,608 1,587
International Beverage 2,637 2,886 2,219
International Bakery 1,153 1,485 1,352
Household and Body Care 2,664 2,880 2,406
9,739 10,917 9,592
Net assets held for sale 7221
Discontinued operations – 185 3,969
Other11,019 651 1,098
Total assets $10,830 $11,755 $14,660
Depreciation
North American Retail Meats $÷÷÷«81 $÷÷«102 $÷÷÷«90
North American Retail Bakery 76 76 80
Foodservice 67 66 72
International Beverage 88 72 67
International Bakery 28 24 25
Household and Body Care 34 35 42
374 375 376
Discontinued operations 5 25 152
Other 24 20 13
Total depreciation $÷÷«403 $÷÷«420 $÷÷«541
Additions to Long-Lived Assets
North American Retail Meats $÷÷«114 $÷÷«194 $÷÷«104
North American Retail Bakery 114 84 147
Foodservice 68 88 71
International Beverage 142 127 113
International Bakery 26 28 24
Household and Body Care 46 74 44
510 595 503
Other 24 51 25
Total additions to long-lived assets $÷÷«534 $÷÷«646 $÷÷«528
1Principally trade receivables of the U.S. operations that are centrally managed, cash
and cash equivalents, certain corporate fixed assets, deferred tax assets and certain
other noncurrent assets.
Note 23 – Geographic Area Information
United States Spain Netherlands Other Total
2008
Sales $6,860 $995 $1,267 $4,090 $13,212
Long-lived assets 3,026 777 428 1,555 5,786
2007
Sales $6,602 $871 $1,077 $3,433 $11,983
Long-lived assets 3,409 1,004 346 1,351 6,110
2006
Sales $6,362 $793 $1,010 $3,010 $11,175
Long-lived assets 3,342 990 341 1,398 6,071
74 Sara Lee Corporation and Subsidiaries