Sara Lee 2008 Annual Report Download - page 24
Download and view the complete annual report
Please find page 24 of the 2008 Sara Lee annual report below. You can navigate through the pages in the report by either clicking on the pages listed below, or by using the keyword search tool below to find specific information within the annual report.-
 1
1 -
2
-
3
-
4
-
5
-
6
-
7
-
8
-
9
-
10
-
11
-
12
-
13
-
 14
14 -
 15
15 -
 16
16 -
 17
17 -
 18
18 -
 19
19 -
 20
20 -
 21
21 -
 22
22 -
 23
23 -
 24
24 -
 25
25 -
 26
26 -
 27
27 -
 28
28 -
 29
29 -
 30
30 -
 31
31 -
 32
32 -
 33
33 -
 34
34 -
35
-
36
-
37
-
38
-
39
-
40
-
41
-
42
-
43
-
44
-
45
-
46
-
47
-
48
-
49
-
50
-
51
-
52
-
53
-
54
-
55
-
56
-
57
-
58
-
59
-
60
-
61
-
62
-
63
-
64
-
65
-
66
-
67
-
68
-
69
-
70
-
71
-
72
-
73
-
74
-
75
-
76
-
77
-
78
-
79
-
80
-
81
-
82
-
83
-
84
 |
 |

Financial review
22 Sara Lee Corporation and Subsidiaries
2008 versus 2007
The North American Retail Bakery segment
also includes the results of the corporation’s Senseo retail coffee
business in the U.S.
Net sales increased $185 million, or 9.2% over 2007. The
increase in net sales was attributable to positive pricing actions to
cover higher commodity costs and higher unit volumes. The pricing
actions were primarily in the fresh bakery channel. Net unit volumes
increased 1.3% due to an increase in unit volumes for branded fresh
and frozen bakery products as well as nonbranded fresh bakery
products. Sales of
Sara Lee
branded products continued their strong
growth, with an increase of 19% versus the prior year.
Operating segment income increased by $57 million in 2008.
The net impact of the change in exit activities, asset and business
dispositions, transformation charges, impairment charges and
accelerated depreciation increased operating segment income by
$44 million. The remaining operating segment income increase of
$13 million, or 29.7%, was due to the benefits of price increases,
hedging gains and savings from continuous improvement programs.
These benefits were offset somewhat by higher costs for key ingre-
dients and wages, and higher SG&A costs driven primarily by labor,
fuel, and selling expenses.
2007 versus 2006
Net sales in 2007 increased $127 million,
or 6.8%, over 2006. Acquisitions completed after the start of fiscal
2006 increased sales by $106 million, or 5.7%, during the period.
The remaining increase in net sales of $21 million, or 1.1%, was pri-
marily attributable to certain selling price increases to offset higher
costs, which was partially offset by a 3.9% decline in unit volumes.
The lower unit volumes were the result of a decline in unbranded U.S.
fresh bread business, particularly with certain private label customers,
which was partially offset by increases in sales of frozen bakery
products. Sales of
Sara Lee
branded products were particularly
strong during the period, up 15% versus the prior year.
The segment reported an operating segment loss of $2 million
in 2007 compared to a loss of $197 million in 2006. The change
in exit activities, transformation and impairment charges and the
other items identified in the table above increased 2007 operating
segment income by $167 million. The remaining operating segment
income increase of $28 million was attributable to improved pricing
and product mix, the benefits of continuous improvement programs,
lower media advertising and promotion spending, and a reduction
in pension and postretirement benefit plan costs partially offset
by higher commodity and labor costs.
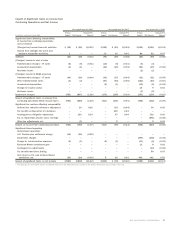
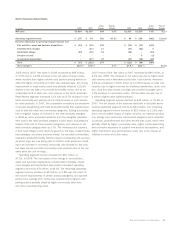
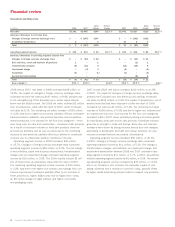
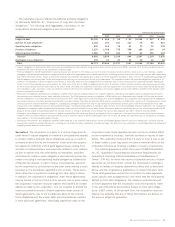
North American Retail Bakery
Dollar Percent Dollar Percent
In millions 2008 2007 Change Change 2007 2006 Change Change
Net sales $2,183 $1,998 $185 9.2 % $1,998 $1,871 $127 6.8%
Increase/(decrease) in net sales from
Acquisition/dispositions $÷÷÷«– $÷÷÷«– $÷÷– $÷«106 $÷÷÷«– $106
Operating segment income (loss) $÷÷«55 $÷÷÷(2) $÷57 NM $÷÷÷(2) $÷(197) $195 99.1%
Increase/(decrease) in operating segment income from
Exit activities, asset and business dispositions $÷÷÷(3) $÷÷÷(8) $÷÷5 $÷÷÷(8) $÷÷÷(7) $÷«(1)
Transformation charges (1) (21) 20 (21) (18) (3)
Impairment charge – (16) 16 (16) (179) 163
Acquisition/dispositions ––– 7–7
Vacation accrual ––– –3(3)
Accelerated depreciation – (3) 3 (3) (7) 4
Total $÷÷÷(4) $÷÷(48) $÷44 $÷÷(41) $÷(208) $167
Gross margin % 46.0 % 46.4 % (0.4) % 46.4 % 46.2 % 0.2%