Sara Lee 2008 Annual Report Download - page 28
Download and view the complete annual report
Please find page 28 of the 2008 Sara Lee annual report below. You can navigate through the pages in the report by either clicking on the pages listed below, or by using the keyword search tool below to find specific information within the annual report.-
 1
1 -
2
-
3
-
4
-
5
-
6
-
7
-
8
-
9
-
10
-
11
-
12
-
13
-
14
-
15
-
16
-
17
-
 18
18 -
 19
19 -
 20
20 -
 21
21 -
 22
22 -
 23
23 -
 24
24 -
 25
25 -
 26
26 -
 27
27 -
 28
28 -
 29
29 -
 30
30 -
 31
31 -
 32
32 -
 33
33 -
 34
34 -
 35
35 -
 36
36 -
 37
37 -
 38
38 -
39
-
40
-
41
-
42
-
43
-
44
-
45
-
46
-
47
-
48
-
49
-
50
-
51
-
52
-
53
-
54
-
55
-
56
-
57
-
58
-
59
-
60
-
61
-
62
-
63
-
64
-
65
-
66
-
67
-
68
-
69
-
70
-
71
-
72
-
73
-
74
-
75
-
76
-
77
-
78
-
79
-
80
-
81
-
82
-
83
-
84
 |
 |

Financial review
26 Sara Lee Corporation and Subsidiaries
2008 versus 2007
Net sales in 2008 increased $249 million, or
12.2%. The impact of changes in foreign currency exchange rates
increased reported net sales by $197 million, or 9.9%, primarily due
to the strengthening of the European euro, Indian rupee, Danish
krone and the British pound. The 2008 net sales includes $2 million
from an acquisition made after the start of 2007, which increased
net sales by 0.1%. The remaining net sales increase of $50 million,
or 2.2%, was due to higher unit volumes, partially offset by increased
trade promotions related to new product launches and competitive
market pressures. Unit volumes for the four core categories – shoe
care, body care, air care and insecticides – increased 4.6%, primarily
as a result of increased volumes in body care products driven by
promotional activities and air care products due to the continuing
success of new products, partially offset by a decline in insecticide
volumes due to unfavorable weather conditions in Europe.
Operating segment income in 2008 increased $43 million,
or 15.7%. Changes in foreign currency exchange rates increased
operating segment income by $24 million, or 8.9%. The net change
in exit activities, asset and business dispositions, transformation
charges and an impairment charge increased operating segment
income by $10 million, or 3.8%. The 2008 results include $1 mil-
lion of losses from an acquisition made after the start of 2007.
The remaining operating segment income increase of $10 million,
or 3.3%, was due to the higher unit volumes and savings from con-
tinuous improvement initiatives, partially offset by an increase in
trade promotions, higher SG&A costs due to higher labor costs,
an $8 million charge for legal matters and higher commodity
and packaging costs.
2007 versus 2006
Net sales increased $215 million, or 11.8%
in 2007. The impact of changes in foreign currency exchange rates,
primarily the European euro and British pound sterling, increased
net sales by $102 million, or 5.9%. The impact of acquisitions, net of
product lines that had been disposed of after the start of 2006
increased net sales by $7 million, or 0.4%. The remaining net sales
increase of $106 million, or 5.5%, was due to higher unit volumes and
an improved product mix. Unit volumes for the four core categories
increased 5.6% in 2007, driven primarily by strong unit volume growth
for insecticides, body care and air care products. Insecticide volumes
grew due to strength in India and Europe. Body care unit volumes
increases were driven by strong volumes across this core category
particularly in deodorants and bath and shower products. Air care
volumes increased behind new product introductions.
Operating segment income increased $56 million, or 25.7%,
in 2007. Changes in foreign currency exchange rates increased
operating segment income by $11 million, or 5.2%. The change in
transformation charges, exit activities, an impairment charge, and
accelerated depreciation between 2006 and 2007 increased oper-
ating segment income by $11 million, or 7.7%, in 2007. Acquisitions
reduced operating segment income by $1 million, or 0.5%. The remain-
ing operating segment income increased by $35 million, or 13.3%,
due to an increase in unit volumes, the favorable impact of cost
saving initiatives and a reduction in pension costs, partially offset
by higher media advertising and promotion to support new products.
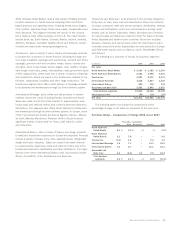
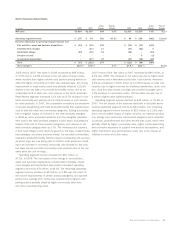
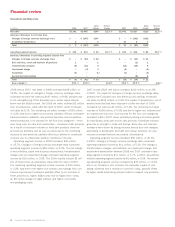
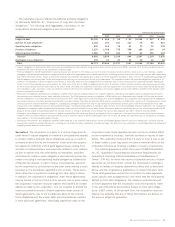
Household and Body Care
Dollar Percent Dollar Percent
In millions 2008 2007 Change Change 2007 2006 Change Change
Net sales $2,291 $2,042 $249 12.2 % $2,042 $1,827 $215 11.8 %
Increase/(decrease) in net sales from
Changes in foreign currency exchange rates $÷÷÷«– $÷(197) $197 $÷÷÷«– $÷(102) $102
Acquisition/dispositions 2–2 1037
Total $÷÷÷«2 $÷(197) $199 $÷÷«10 $÷÷(99) $109
Operating segment income $÷«315 $÷«272 $÷43 15.7 % $÷«272 $÷«216 $÷56 25.7 %
Increase/(decrease) in operating segment income from
Changes in foreign currency exchange rates $÷÷÷«– $÷÷(24) $÷24 $÷÷÷«– $÷÷(11) $÷11
Exit activities, asset and business dispositions 1–1 –(1)1
Transformation charges (8) (13) 5 (13) (19) 6
Impairment charge – (4) 4 (4) – (4)
Acquisition (1) – (1) (1) – (1)
Accelerated depreciation ––– –(8)8
Total $÷÷÷(8) $÷÷(41) $÷33 $÷÷(18) $÷÷(39) $÷21
Gross margin % 49.4 % 49.8 % (0.4) % 49.8 % 49.9 % (0.1) %