Sara Lee 2008 Annual Report Download - page 2
Download and view the complete annual report
Please find page 2 of the 2008 Sara Lee annual report below. You can navigate through the pages in the report by either clicking on the pages listed below, or by using the keyword search tool below to find specific information within the annual report.-
 1
1 -
 2
2 -
 3
3 -
 4
4 -
 5
5 -
 6
6 -
 7
7 -
 8
8 -
 9
9 -
 10
10 -
 11
11 -
 12
12 -
 13
13 -
14
-
15
-
16
-
17
-
18
-
19
-
20
-
21
-
22
-
23
-
24
-
25
-
26
-
27
-
28
-
29
-
30
-
31
-
32
-
33
-
34
-
35
-
36
-
37
-
38
-
39
-
40
-
41
-
42
-
43
-
44
-
45
-
46
-
47
-
48
-
49
-
50
-
51
-
52
-
53
-
54
-
55
-
56
-
57
-
58
-
59
-
60
-
61
-
62
-
63
-
64
-
65
-
66
-
67
-
68
-
69
-
70
-
71
-
72
-
73
-
74
-
75
-
76
-
77
-
78
-
79
-
80
-
81
-
82
-
83
-
84
 |
 |

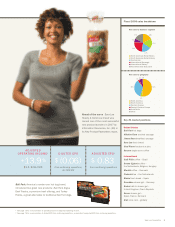
About Sara Lee Corporation
Each and every day, Sara Lee (NYSE: SLE)
delights millions of consumers and cus-
tomers around the world. The company has
one of the world’s best-loved and leading
portfolios with its innovative and trusted food,
beverage, household and body care brands,
including
Ambi Pur, Ball Park, Douwe Egberts,
Hillshire Farm, Jimmy Dean, Kiwi, Sanex,
Sara Lee
and
Senseo
. In fiscal 2008, Sara Lee
generated more than $13 billion in net sales
across approximately 200 countries. The
Sara Lee community consists of 44,000
employees worldwide.
Contents
1Letter to stockholders
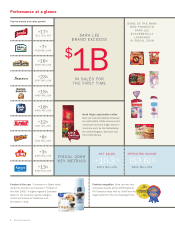
2Performance at a glance
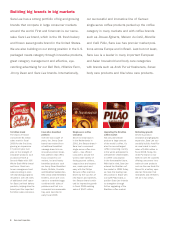
4 Building big brands in big markets
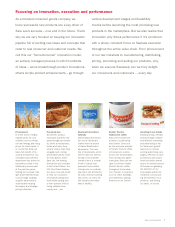
7Focusing on innovation,
execution and performance
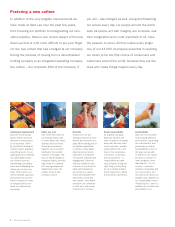
8Fostering a new culture
9Financial section
80 Directors and senior corporate officers
81 Investor information
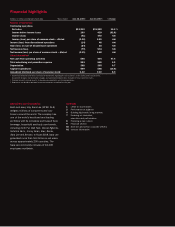
Dollars in millions except per share data Years ended June 28, 2008 1June 30, 2007 1% Change
Results of Operations
Continuing operations
Net sales $13,212 $11,983 10.3 %
Income before income taxes 160 429 (62.8)
Income (loss) (41) 440 NM
Income (loss) per share of common stock – diluted (0.06) 0.59 NM
Income (loss) from discontinued operations (14) 48 NM
Gain (loss) on sale of discontinued operations (24) 16 NM
Net income (loss) (79) 504 NM
Net income (loss) per share of common stock – diluted (0.11) 0.68 NM
Other Information2
Net cash from operating activities 596 404 47.4
Total advertising and promotion expense 594 566 4.9
Depreciation 398 395 0.7
Capital expenditures 509 598 (14.9)
Annualized dividends per share of common stock30.42 0.40 5.0
1See Financial Review and Notes to Financial Statements regarding the exit activities, asset and business dispositions,
impairment charges, transformation charges and accelerated depreciation included in these reported results.
2Financial amounts include results for businesses reported in continuing operations.
3Represents the dividend declared in the fourth quarter, annualized for the year.
Financial highlights