Pitney Bowes 2015 Annual Report Download - page 97
Download and view the complete annual report
Please find page 97 of the 2015 Pitney Bowes annual report below. You can navigate through the pages in the report by either clicking on the pages listed below, or by using the keyword search tool below to find specific information within the annual report.-
 1
1 -
2
-
3
-
4
-
5
-
6
-
7
-
8
-
9
-
10
-
11
-
12
-
13
-
14
-
15
-
16
-
17
-
18
-
19
-
20
-
21
-
22
-
23
-
24
-
25
-
26
-
27
-
28
-
29
-
30
-
31
-
32
-
33
-
34
-
35
-
36
-
37
-
38
-
39
-
40
-
41
-
42
-
43
-
44
-
45
-
46
-
47
-
48
-
49
-
50
-
51
-
52
-
53
-
54
-
55
-
56
-
57
-
58
-
59
-
60
-
61
-
62
-
63
-
64
-
65
-
66
-
67
-
68
-
69
-
70
-
71
-
72
-
73
-
74
-
75
-
76
-
77
-
78
-
79
-
80
-
81
-
82
-
83
-
84
-
85
-
86
-
 87
87 -
 88
88 -
 89
89 -
 90
90 -
 91
91 -
 92
92 -
 93
93 -
 94
94 -
 95
95 -
 96
96 -
 97
97 -
 98
98 -
 99
99 -
 100
100 -
 101
101 -
 102
102 -
 103
103 -
 104
104 -
 105
105 -
 106
106 -
 107
107 -
108
-
109
-
110
-
111
-
112
-
113
-
114
-
115
-
116
-
117
-
118
 |
 |

PITNEY BOWES INC.
NOTES TO CONSOLIDATED FINANCIAL STATEMENTS
(Tabular dollars in thousands, except per share amounts)
81
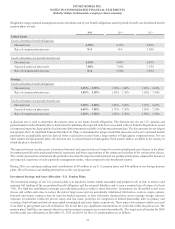
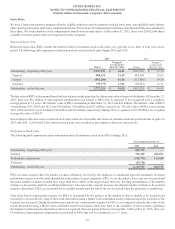
The items accounting for the difference between income taxes computed at the federal statutory rate and our provision for income taxes
consist of the following:
Years Ended December 31,
2015 2014 2013
Federal statutory provision $ 213,789 $ 150,920 $ 134,389
State and local income taxes 17,769 (1,379) (1,733)
Other impact of foreign operations (6,492)(12,668) (28,238)
Tax exempt income/reimbursement (1,171)(1,327) (1,672)
Federal income tax credits/incentives (10,959)(17,905) (10,282)
Unrealized stock compensation benefits 2,658 2,318 2,292
Resolution of U.S. tax examinations —(5,856) (3,853)
Outside basis differences (27,110)— (13,214)
Other, net 1,294 (1,288) 278
Provision for income taxes $ 189,778 $ 112,815 $ 77,967
Other impacts of foreign operations include income of foreign affiliates taxed at rates other than the 35% U.S. statutory rate, the accrual
or release of tax uncertainty amounts related to foreign operations, the tax impacts of foreign earnings repatriation and the U.S. foreign
tax credit impacts of foreign income taxed in the U.S.
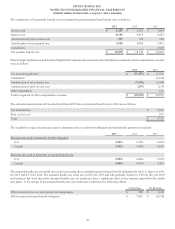
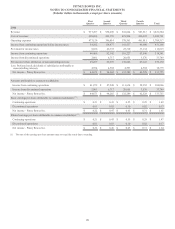
Deferred tax liabilities and assets at December 31, 2015 and 2014 consisted of the following:
December 31,
2015 2014
Deferred tax liabilities:
Depreciation $(69,622)$ (60,282)
Deferred profit (for tax purposes) on sale to finance subsidiary (108,061)(114,633)
Lease revenue and related depreciation (188,231)(205,683)
Amortizable intangibles (119,453)(74,034)
Other (41,149)(64,900)
Gross deferred tax liabilities (526,516)(519,532)
Deferred tax assets:
Nonpension postretirement benefits 79,861 82,181
Pension 104,166 141,492
Inventory and equipment capitalization 14,934 18,502
Restructuring charges 14,238 35,432
Long-term incentives 22,111 25,718
Net operating loss 111,351 102,686
Tax credit carry forwards 54,183 47,493
Tax uncertainties gross-up 21,191 22,851
Other 96,412 125,512
Gross deferred tax assets 518,447 601,867
Less: Valuation allowance (132,624)(116,935)
Net deferred tax assets 385,823 484,932
Total deferred taxes, net $(140,693)$ (34,600)
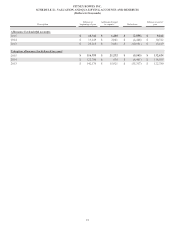
A valuation allowance is recognized to reduce the total deferred tax assets to an amount that will more-likely-than-not be realized. The
valuation allowance relates primarily to certain foreign, state and local net operating loss and tax credit carryforwards that are more-
likely-than-not to expire unutilized.