Pitney Bowes 2015 Annual Report Download - page 36
Download and view the complete annual report
Please find page 36 of the 2015 Pitney Bowes annual report below. You can navigate through the pages in the report by either clicking on the pages listed below, or by using the keyword search tool below to find specific information within the annual report.-
 1
1 -
2
-
3
-
4
-
5
-
6
-
7
-
8
-
9
-
10
-
11
-
12
-
13
-
14
-
15
-
16
-
17
-
18
-
19
-
20
-
21
-
22
-
23
-
24
-
25
-
 26
26 -
 27
27 -
 28
28 -
 29
29 -
 30
30 -
 31
31 -
 32
32 -
 33
33 -
 34
34 -
 35
35 -
 36
36 -
 37
37 -
 38
38 -
 39
39 -
 40
40 -
 41
41 -
 42
42 -
 43
43 -
 44
44 -
 45
45 -
 46
46 -
47
-
48
-
49
-
50
-
51
-
52
-
53
-
54
-
55
-
56
-
57
-
58
-
59
-
60
-
61
-
62
-
63
-
64
-
65
-
66
-
67
-
68
-
69
-
70
-
71
-
72
-
73
-
74
-
75
-
76
-
77
-
78
-
79
-
80
-
81
-
82
-
83
-
84
-
85
-
86
-
87
-
88
-
89
-
90
-
91
-
92
-
93
-
94
-
95
-
96
-
97
-
98
-
99
-
100
-
101
-
102
-
103
-
104
-
105
-
106
-
107
-
108
-
109
-
110
-
111
-
112
-
113
-
114
-
115
-
116
-
117
-
118
 |
 |

20
Software
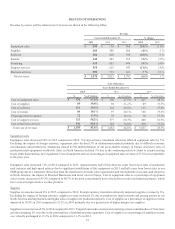
Software revenue decreased 10% in 2015 compared to 2014. Foreign currency translation adversely impacted software revenue by 5%.
Software revenue in 2015 compared to 2014 was also impacted by 4% due to more significant licensing deals in 2014 compared to 2015.
Excluding the impact of foreign currency and the significant licensing deals in 2014, software revenue declined 1%, primarily due to
declines in maintenance, data and services revenue. Cost of software as a percentage of software revenue increased to 29.4% in 2015
compared to 28.8% in 2014 primarily due to the decline in high-margin licensing revenue.
Software revenue increased 8% in 2014 compared to 2013, primarily due to a 33% increase in worldwide licensing revenue from our
software solutions products, particularly enterprise location intelligence. Cost of software as a percentage of software revenue increased
to 28.8% compared to 27.8% in the prior year primarily due to investments in the specialization of the software sales channel and higher
production costs.
Rentals
Rentals revenue decreased 9% in 2015 compared to 2014. Foreign currency translation adversely impacted rentals revenue by 3%.
Excluding the impact of foreign currency, rentals revenue declined 6% primarily due to the continuing decline in the number of installed
meters and shift by clients to less-featured, lower cost machines. Cost of rentals as a percentage of rentals revenue improved to 19.1%
in 2015 compared to 20.1% in 2014 primarily due to lower depreciation.
Rentals revenue decreased 5% in 2014 compared to 2013. Rentals revenue declined 4% due to a reduction in the number of installed
meters and clients downgrading to lower cost, less functional machines and 1% due to lower rentals revenue in France. Cost of rentals
as a percentage of rentals revenue increased to 20.1% compared to 19.6% in the prior year primarily due to a higher proportion of fixed
costs as a percentage of revenue.
Financing
Financing revenue decreased 5% in 2015 compared to 2014. Foreign currency translation accounted for 3% of the decrease and lower
equipment sales in prior periods and a declining lease portfolio accounted for the remaining decrease. Financing revenue decreased 4%
in 2014 compared to 2013 as a result of declining equipment sales in prior years.
We allocate a portion of our total cost of borrowing to financing interest expense. In computing financing interest expense, we assume
a 10:1 debt to equity leverage ratio and apply our overall effective interest rate to the average outstanding finance receivables. Due to
declining equipment sales in prior periods, average outstanding finance receivables declined. As a result, financing interest expense
declined 9% in 2015 compared to 2014. Financing interest expense as a percentage of financing revenue improved to 17.5% in 2015
compared to 18.1% in 2014. Financing interest expense as a percentage of financing revenue increased in 2014 as compared to 2013 due
to an increase in our overall effective interest rate.
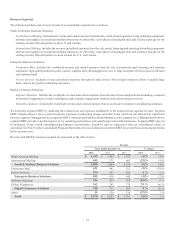
Support Services
Support services revenue decreased 11% in 2015 compared to 2014, primarily due to 5% from foreign currency translation and 2% from
Divested Businesses. Support services revenue was also impacted by lower maintenance contracts on production mail equipment as some
in-house mailers moved their mail processing to third-party service bureaus who service some of their own equipment. Cost of support
services as a percentage of support services revenue decreased to 58.2% in 2015 compared to 60.3% in 2014 primarily due to expense
reductions and productivity initiatives.
Support services revenue decreased 3% in 2014 compared to 2013 primarily due to declines in our mailing business due to fewer installed
mailing machines in North America and the impact of Divested Businesses. Cost of support services as a percentage of support services
revenue improved to 60.3% in 2014 compared to 61.9% in 2013 primarily due to continued focus on expense reductions and productivity
initiatives.
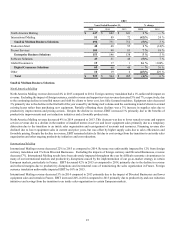
Business Services
Business services revenue increased 3% in 2015 compared to 2014. Business services revenue for 2015 was impacted by the sale of
Imagitas in May 2015 and the acquisition of Borderfree in June 2015. Excluding the impacts of these transactions, business services
revenue increased 5% in 2015 compared to 2014. Higher volumes of mail processed in Presort Services increased business services
revenue 2% and additional volumes of packages shipped from our U.K. outbound cross-border service facility increased business services
revenue 4%. Cost of business services as a percentage of business services revenue improved to 68.1% in 2015 and compared to 70.0%
in 2014, primarily due to operational efficiencies in Presort Services and higher revenue.