Pitney Bowes 2015 Annual Report Download - page 35
Download and view the complete annual report
Please find page 35 of the 2015 Pitney Bowes annual report below. You can navigate through the pages in the report by either clicking on the pages listed below, or by using the keyword search tool below to find specific information within the annual report.-
 1
1 -
2
-
3
-
4
-
5
-
6
-
7
-
8
-
9
-
10
-
11
-
12
-
13
-
14
-
15
-
16
-
17
-
18
-
19
-
20
-
21
-
22
-
23
-
24
-
 25
25 -
 26
26 -
 27
27 -
 28
28 -
 29
29 -
 30
30 -
 31
31 -
 32
32 -
 33
33 -
 34
34 -
 35
35 -
 36
36 -
 37
37 -
 38
38 -
 39
39 -
 40
40 -
 41
41 -
 42
42 -
 43
43 -
 44
44 -
 45
45 -
46
-
47
-
48
-
49
-
50
-
51
-
52
-
53
-
54
-
55
-
56
-
57
-
58
-
59
-
60
-
61
-
62
-
63
-
64
-
65
-
66
-
67
-
68
-
69
-
70
-
71
-
72
-
73
-
74
-
75
-
76
-
77
-
78
-
79
-
80
-
81
-
82
-
83
-
84
-
85
-
86
-
87
-
88
-
89
-
90
-
91
-
92
-
93
-
94
-
95
-
96
-
97
-
98
-
99
-
100
-
101
-
102
-
103
-
104
-
105
-
106
-
107
-
108
-
109
-
110
-
111
-
112
-
113
-
114
-
115
-
116
-
117
-
118
 |
 |

19
RESULTS OF OPERATIONS
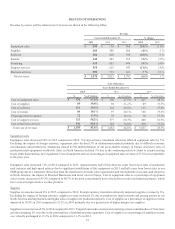
Revenue by source and the related cost of revenue are shown in the following tables:
Revenue
Years Ended December 31, % change
2015 2014 2013 2015 2014
Equipment sales $ 695 $ 770 $ 868 (10)% (11)%
Supplies 288 300 286 (4)% 5%
Software 386 430 398 (10)% 8%
Rentals 442 485 512 (9)% (5)%
Financing 410 433 449 (5)% (4)%
Support services 555 625 647 (11)% (3)%
Business services 802 779 631 3% 23 %
Total revenue $ 3,578 $ 3,822 $ 3,791 (6)% 1%
Cost of Revenue
Years Ended December 31,
2015 2014 2013
$ % of revenue $ % of revenue $ % of revenue
Cost of equipment sales $ 331 47.6% $ 366 47.5 % $ 423 48.7%
Cost of supplies 89 30.8% 94 31.2 % 89 31.3%
Cost of software 114 29.4% 124 28.8 % 111 27.8%
Cost of rentals 84 19.1% 97 20.1 % 100 19.6%
Financing interest expense 72 17.5% 78 18.1 % 78 17.3%
Cost of support services 323 58.2% 377 60.3 % 400 61.9%
Cost of business services 546 68.1% 545 70.0 % 450 71.3%
Total cost of revenue $ 1,559 43.6% $ 1,681 44.0 % $ 1,651 43.5%
Equipment sales
Equipment sales decreased 10% in 2015 compared to 2014. Foreign currency translation adversely affected equipment sales by 5%.
Excluding the impact of foreign currency, equipment sales declined 3% in international markets primarily due to difficult economic
circumstances and productivity disruptions caused by the implementation of our go-to-market strategy in Europe and lower sales of
production mail equipment worldwide. Sales in North America declined 1% due to the continuing trend of clients to extend existing
leases rather than purchase new equipment. Cost of equipment sales as a percentage of equipment sales revenue of 47.6% was comparable
to the prior year.
Equipment sales decreased 11% in 2014 compared to 2013. Approximately half of this decrease came from lower sales of production
mail inserters and high-speed printers due to significant installations of this equipment in 2013 and half came from lower sales in our
SMB group due to a temporary distraction from the transition to an inside sales organization and reassignment of accounts and resources
in North America, the impact of Divested Businesses and lower sales in France. Cost of equipment sales as a percentage of equipment
sales revenue decreased to 47.5% compared to 48.7% in the prior year primarily due to the decline in sales of production printers, which
have a lower margin relative to other products.
Supplies
Supplies revenue decreased 4% in 2015 compared to 2014. Foreign currency translation adversely impacted supplies revenue by 6%.
Excluding the impact of foreign currency, supplies revenue increased 2% due to productivity improvements and pricing actions in our
North America mailing business and higher sales of supplies for production printers. Cost of supplies as a percentage of supplies revenue
improved to 30.8% in 2015 compared to 31.2% in 2014 primarily due to a greater mix of higher margin core supplies.
Supplies revenue increased 5% in 2014 compared to 2013. Targeted outreach to customers and pricing actions contributed to a 3% increase
and the remaining 2% was due to the growing base of production print equipment. Cost of supplies as a percentage of supplies revenue
was virtually unchanged at 31.2% in 2014 compared to 31.3% in 2013.