Pitney Bowes 2015 Annual Report Download - page 70
Download and view the complete annual report
Please find page 70 of the 2015 Pitney Bowes annual report below. You can navigate through the pages in the report by either clicking on the pages listed below, or by using the keyword search tool below to find specific information within the annual report.-
 1
1 -
2
-
3
-
4
-
5
-
6
-
7
-
8
-
9
-
10
-
11
-
12
-
13
-
14
-
15
-
16
-
17
-
18
-
19
-
20
-
21
-
22
-
23
-
24
-
25
-
26
-
27
-
28
-
29
-
30
-
31
-
32
-
33
-
34
-
35
-
36
-
37
-
38
-
39
-
40
-
41
-
42
-
43
-
44
-
45
-
46
-
47
-
48
-
49
-
50
-
51
-
52
-
53
-
54
-
55
-
56
-
57
-
58
-
59
-
 60
60 -
 61
61 -
 62
62 -
 63
63 -
 64
64 -
 65
65 -
 66
66 -
 67
67 -
 68
68 -
 69
69 -
 70
70 -
 71
71 -
 72
72 -
 73
73 -
 74
74 -
 75
75 -
 76
76 -
 77
77 -
 78
78 -
 79
79 -
 80
80 -
81
-
82
-
83
-
84
-
85
-
86
-
87
-
88
-
89
-
90
-
91
-
92
-
93
-
94
-
95
-
96
-
97
-
98
-
99
-
100
-
101
-
102
-
103
-
104
-
105
-
106
-
107
-
108
-
109
-
110
-
111
-
112
-
113
-
114
-
115
-
116
-
117
-
118
 |
 |

PITNEY BOWES INC.
NOTES TO CONSOLIDATED FINANCIAL STATEMENTS
(Tabular dollars in thousands, except per share amounts)
54
Assets
December 31,
2015 2014 2013
North America Mailing $ 2,421,095 $ 2,614,123 $ 2,767,743
International Mailing 594,540 687,233 856,073
Small & Medium Business Solutions 3,015,635 3,301,356 3,623,816
Production Mail 244,156 266,831 305,428
Presort Services 374,647 346,850 343,206
Enterprise Business Solutions 618,803 613,681 648,634
Software Solutions 858,308 884,190 866,319
Global Ecommerce 580,662 117,744 154,402
Digital Commerce Solutions 1,438,970 1,001,934 1,020,721
Other — 210,171 221,292
Total for reportable segments 5,073,408 5,127,142 5,514,463
Reconciliation to consolidated amount:
Cash and cash equivalents 650,557 1,054,118 886,788
Short-term investments 117,021 49,135 52,146
Other corporate assets 300,476 261,294 222,641
Discontinued operations —— 101,398
Consolidated assets $ 6,141,462 $ 6,499,702 $ 6,777,436
Identifiable long-lived assets:
United States $ 437,704 $ 391,311 $ 351,772
Outside United States 73,046 94,160 119,545
Total $ 510,750 $ 485,471 $ 471,317
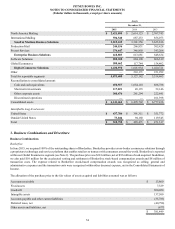
3. Business Combinations and Divestiture
Business Combinations
Borderfree
In June 2015, we acquired 100% of the outstanding shares of Borderfree. Borderfree provides cross-border ecommerce solutions through
a proprietary technology and services platform that enables retailers to transact with consumers around the world. Borderfree is reported
within our Global Ecommerce segment (see Note 2). The purchase price was $381 million, net of $92 million of cash acquired. In addition,
we also paid $10 million for the accelerated vesting and settlement of Borderfree stock-based compensation awards and $8 million of
transaction costs. The expense related to Borderfree stock-based compensation awards was recognized as selling, general and
administrative expenses and the transaction costs were recognized within other (income) expense, net in the Consolidated Statements of
Income.
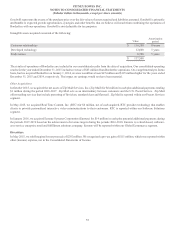
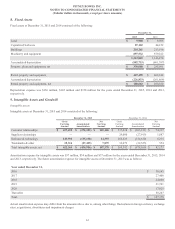
The allocation of the purchase price to the fair values of assets acquired and liabilities assumed was as follows:
Accounts receivable $ 13,860
Fixed assets 7,329
Goodwill 300,020
Intangible assets 137,500
Accounts payable and other current liabilities (35,785)
Deferred taxes, net (40,798)
Other assets and liabilities, net (677)
$ 381,449