Pitney Bowes 2015 Annual Report Download - page 15
Download and view the complete annual report
Please find page 15 of the 2015 Pitney Bowes annual report below. You can navigate through the pages in the report by either clicking on the pages listed below, or by using the keyword search tool below to find specific information within the annual report.-
 1
1 -
2
-
3
-
4
-
 5
5 -
 6
6 -
 7
7 -
 8
8 -
 9
9 -
 10
10 -
 11
11 -
 12
12 -
 13
13 -
 14
14 -
 15
15 -
 16
16 -
 17
17 -
 18
18 -
 19
19 -
 20
20 -
 21
21 -
 22
22 -
 23
23 -
 24
24 -
 25
25 -
26
-
27
-
28
-
29
-
30
-
31
-
32
-
33
-
34
-
35
-
36
-
37
-
38
-
39
-
40
-
41
-
42
-
43
-
44
-
45
-
46
-
47
-
48
-
49
-
50
-
51
-
52
-
53
-
54
-
55
-
56
-
57
-
58
-
59
-
60
-
61
-
62
-
63
-
64
-
65
-
66
-
67
-
68
-
69
-
70
-
71
-
72
-
73
-
74
-
75
-
76
-
77
-
78
-
79
-
80
-
81
-
82
-
83
-
84
-
85
-
86
-
87
-
88
-
89
-
90
-
91
-
92
-
93
-
94
-
95
-
96
-
97
-
98
-
99
-
100
-
101
-
102
-
103
-
104
-
105
-
106
-
107
-
108
-
109
-
110
-
111
-
112
-
113
-
114
-
115
-
116
-
117
-
118
 |
 |

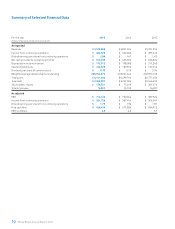
11Pitney Bowes Annual Report 2015
Reconciliation of Reported Consolidated
Results to Adjusted Results
For the year 2015 2014 2013
(Dollars in thousands, except per share data)
Income from continuing operations before income taxes, as reported $ 610,825 $ 431,196 $ 383,954
Restructuring charges and asset impairments, net 25,782 84,560 84,344
Gain on sale/disposition of businesses (107,268) — —
Acquisition and disposition transaction costs 9,930 — —
Legal settlement 6,900 — —
Acquisition-related compensation expense 10,483 — —
Investment divestiture 100 (15,919) —
Extinguishment of debt — 61,657 32,639
Income from continuing operations before income taxes, as adjusted
556,752 561,494 500,937
Provision for income taxes, as adjusted
186,651 155,705 116,015
Preferred stock dividends of subsidiaries attributable to
noncontrolling interests 18,375 18,375 18,375
Income from continuing operations, as adjusted
351,726 387,414 366,547
Interest expense, net
159,374 169,450 186,987
Provision for income taxes, as adjusted 186,651 155,705 116,015
Preferred stock dividends of subsidiaries attributable to
noncontrolling interests 18,375 18,375 18,375
EBIT $ 716,126 $ 730,944 $ 687,924
Diluted earnings per share from continuing operations, as reported $ 2.00 $ 1.47 $ 1.42
Restructuring charges and asset impairments, net 0.09 0.29 0.29
Gain on sale/disposition of businesses (0.42) — —
Acquisition and disposition transaction costs 0.06 — —
Legal settlement 0.02 — —
Acquisition-related compensation expense 0.04 — —
Investment divestiture (0.04) (0.05) —
Extinguishment of debt — 0.19 0.10
Diluted earnings per share from continuing operations, as adjusted $ 1.75 $ 1.90 $ 1.81
Net cash provided by operating activities, as reported $ 514,639 $ 655,526 $ 624,824
Capital expenditures (166,329) (180,556) (137,512)
Restructuring payments 62,086 56,162 59,520
Net tax and other payments (receipts) 20,602 (5,737) 75,545
Reserve account deposits (24,202) (15,666) (20,104)
Acquisition-related compensation payment 10,483 — —
Tax payment related to sale of Imagitas 21,224 — —
Cash transaction fees related to acquisitions and dispositions 17,971 — —
Extinguishment of debt — 61,657 32,639
Free cash fl ow, as adjusted $ 456,474 $ 571,386 $ 634,912
The sum of earnings per share amounts may not equal the totals due to rounding.
The Company’s fi nancial results are reported in accordance with generally accepted accounting principles (GAAP). The Company uses measures such as adjusted earnings before interest and
taxes (EBIT), adjusted earnings per share, adjusted income from continuing operations and free cash fl ow to exclude the impact of special items like restructuring charges, tax adjustments,
and goodwill and asset write-downs, because, while these are actual Company expenses, they can mask underlying trends associated with its business. Such items are often inconsistent
in amount and frequency and as such, the adjustments allow an investor greater insight into, and are intended to be more indicative of, the current fundamental operating trends, ongoing
operations and economic results of the Company.
Free cash fl ow measures have limitations, which management compensates for by using a combination of GAAP cash fl ow and free cash fl ow in doing its planning. However, free cash fl ow
provides investors insight into the amount of cash that management could have available for other discretionary uses. It adjusts GAAP cash from operations for capital expenditures, as well
as special items like cash used for restructuring charges, unusual tax settlements or payments and contributions to pension funds.
The adjusted fi nancial information should not be construed as an alternative to our reported results determined in accordance with GAAP. Further, our defi nition of adjusted fi nancial
measures may di er from similarly titled measures used by other companies.