Pitney Bowes 2015 Annual Report Download - page 94
Download and view the complete annual report
Please find page 94 of the 2015 Pitney Bowes annual report below. You can navigate through the pages in the report by either clicking on the pages listed below, or by using the keyword search tool below to find specific information within the annual report.-
 1
1 -
2
-
3
-
4
-
5
-
6
-
7
-
8
-
9
-
10
-
11
-
12
-
13
-
14
-
15
-
16
-
17
-
18
-
19
-
20
-
21
-
22
-
23
-
24
-
25
-
26
-
27
-
28
-
29
-
30
-
31
-
32
-
33
-
34
-
35
-
36
-
37
-
38
-
39
-
40
-
41
-
42
-
43
-
44
-
45
-
46
-
47
-
48
-
49
-
50
-
51
-
52
-
53
-
54
-
55
-
56
-
57
-
58
-
59
-
60
-
61
-
62
-
63
-
64
-
65
-
66
-
67
-
68
-
69
-
70
-
71
-
72
-
73
-
74
-
75
-
76
-
77
-
78
-
79
-
80
-
81
-
82
-
83
-
 84
84 -
 85
85 -
 86
86 -
 87
87 -
 88
88 -
 89
89 -
 90
90 -
 91
91 -
 92
92 -
 93
93 -
 94
94 -
 95
95 -
 96
96 -
 97
97 -
 98
98 -
 99
99 -
 100
100 -
 101
101 -
 102
102 -
 103
103 -
 104
104 -
105
-
106
-
107
-
108
-
109
-
110
-
111
-
112
-
113
-
114
-
115
-
116
-
117
-
118
 |
 |

PITNEY BOWES INC.
NOTES TO CONSOLIDATED FINANCIAL STATEMENTS
(Tabular dollars in thousands, except per share amounts)
78
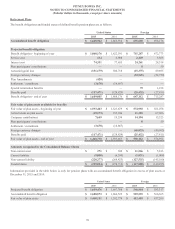
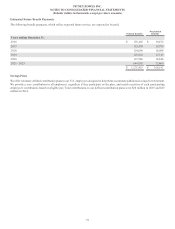
The components of net periodic benefit cost for nonpension postretirement benefit plans were as follows:
2015 2014 2013
Service cost $ 2,455 $ 2,683 $ 3,684
Interest cost 8,799 9,951 9,503
Amortization of prior service cost 297 159 128
Amortization of net actuarial loss 7,528 5,949 7,433
Curtailment —— 2,920
Net periodic benefit cost $ 19,079 $ 18,742 $ 23,668
Other changes in plan assets and benefit obligation for nonpension postretirement benefit plans recognized in other comprehensive income
were as follows:
2015 2014
Net actuarial (gain) loss $(31,253)$ 37,532
Curtailment — (2,160)
Amortization of net actuarial loss (7,528)(5,949)
Amortization of prior service cost (297)(159)
Other adjustments 412
Total recognized in other comprehensive income $(39,078)$ 29,676
The estimated amounts that will be amortized from AOCI into net periodic benefit cost in 2016 are as follows:
Net actuarial loss $ 5,438
Prior service cost 297
Total $ 5,735
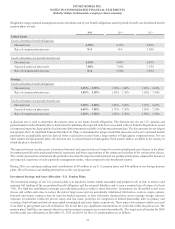
The weighted-average discount rates used to determine end of year benefit obligation and net periodic pension cost include:
2015 2014 2013
Discount rate used to determine benefit obligation
U.S. 4.20% 3.90% 4.40%
Canada 3.95% 3.80% 4.65%
Discount rate used to determine net period benefit cost
U.S. 3.90% 4.40% 3.65%
Canada 3.80% 4.65% 3.90%
The assumed health care cost trend rate used in measuring the accumulated postretirement benefit obligation for the U.S. plan was 6.0%
for 2015 and 6.5% for 2014. The assumed health care trend rate is 6.0% for 2016 and will gradually decline to 5.0% by the year 2019
and remain at that level thereafter. Assumed health care cost trend rates have a significant effect on the amounts reported for the health
care plans. A 1% change in the assumed health care cost trend rates would have the following effects:
1% Increase 1% Decrease
Effect on total of service and interest cost components $ 389 $ (326)
Effect on postretirement benefit obligation $ 7,841 $ (6,730)