Pitney Bowes 2015 Annual Report Download - page 74
Download and view the complete annual report
Please find page 74 of the 2015 Pitney Bowes annual report below. You can navigate through the pages in the report by either clicking on the pages listed below, or by using the keyword search tool below to find specific information within the annual report.-
 1
1 -
2
-
3
-
4
-
5
-
6
-
7
-
8
-
9
-
10
-
11
-
12
-
13
-
14
-
15
-
16
-
17
-
18
-
19
-
20
-
21
-
22
-
23
-
24
-
25
-
26
-
27
-
28
-
29
-
30
-
31
-
32
-
33
-
34
-
35
-
36
-
37
-
38
-
39
-
40
-
41
-
42
-
43
-
44
-
45
-
46
-
47
-
48
-
49
-
50
-
51
-
52
-
53
-
54
-
55
-
56
-
57
-
58
-
59
-
60
-
61
-
62
-
63
-
 64
64 -
 65
65 -
 66
66 -
 67
67 -
 68
68 -
 69
69 -
 70
70 -
 71
71 -
 72
72 -
 73
73 -
 74
74 -
 75
75 -
 76
76 -
 77
77 -
 78
78 -
 79
79 -
 80
80 -
 81
81 -
 82
82 -
 83
83 -
 84
84 -
85
-
86
-
87
-
88
-
89
-
90
-
91
-
92
-
93
-
94
-
95
-
96
-
97
-
98
-
99
-
100
-
101
-
102
-
103
-
104
-
105
-
106
-
107
-
108
-
109
-
110
-
111
-
112
-
113
-
114
-
115
-
116
-
117
-
118
 |
 |

PITNEY BOWES INC.
NOTES TO CONSOLIDATED FINANCIAL STATEMENTS
(Tabular dollars in thousands, except per share amounts)
58
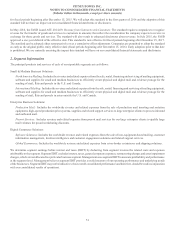
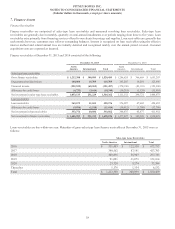
7. Finance Assets
Finance Receivables
Finance receivables are comprised of sales-type lease receivables and unsecured revolving loan receivables. Sales-type lease
receivables are generally due in monthly, quarterly or semi-annual installments over periods ranging from three to five years. Loan
receivables arise primarily from financing services offered to our clients for postage and supplies. Loan receivables are generally due
each month; however, customers may rollover outstanding balances. Interest is recognized on loan receivables using the effective
interest method and related annual fees are initially deferred and recognized ratably over the annual period covered. Customer
acquisition costs are expensed as incurred.
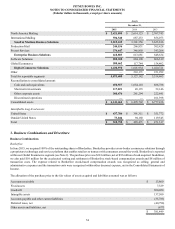
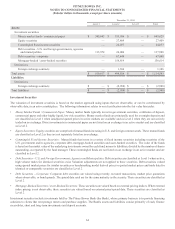
Finance receivables at December 31, 2015 and 2014 consisted of the following:
December 31, 2015 December 31, 2014
North
America International Total
North
America International Total
Sales-type lease receivables
Gross finance receivables $ 1,212,390 $ 308,099 $ 1,520,489 $ 1,286,624 $ 366,669 $ 1,653,293
Unguaranteed residual values 100,000 15,709 115,709 105,205 18,291 123,496
Unearned income (252,522) (68,965) (321,487) (270,196) (83,110) (353,306)
Allowance for credit losses (6,735) (3,614) (10,349) (10,281) (5,129) (15,410)
Net investment in sales-type lease receivables 1,053,133 251,229 1,304,362 1,111,352 296,721 1,408,073
Loan receivables
Loan receivables 363,672 41,604 405,276 376,987 47,665 424,652
Allowance for credit losses (9,896) (1,518) (11,414) (10,912) (1,788) (12,700)
Net investment in loan receivables 353,776 40,086 393,862 366,075 45,877 411,952
Net investment in finance receivables $ 1,406,909 $ 291,315 $ 1,698,224 $ 1,477,427 $ 342,598 $ 1,820,025
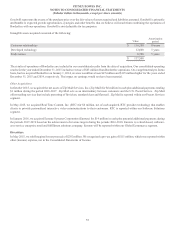
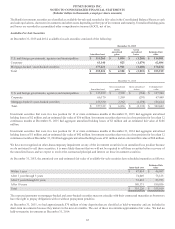
Loans receivables are due within one year. Maturities of gross sales-type lease finance receivables at December 31, 2015 were as
follows:
Sales-type Lease Receivables
North America International Total
2016 $ 551,403 $ 122,350 $ 673,753
2017 340,562 87,141 427,703
2018 200,836 56,907 257,743
2019 91,091 31,073 122,164
2020 23,320 9,274 32,594
Thereafter 5,178 1,354 6,532
Total $ 1,212,390 $ 308,099 $ 1,520,489