Pitney Bowes 2015 Annual Report Download - page 73
Download and view the complete annual report
Please find page 73 of the 2015 Pitney Bowes annual report below. You can navigate through the pages in the report by either clicking on the pages listed below, or by using the keyword search tool below to find specific information within the annual report.-
 1
1 -
2
-
3
-
4
-
5
-
6
-
7
-
8
-
9
-
10
-
11
-
12
-
13
-
14
-
15
-
16
-
17
-
18
-
19
-
20
-
21
-
22
-
23
-
24
-
25
-
26
-
27
-
28
-
29
-
30
-
31
-
32
-
33
-
34
-
35
-
36
-
37
-
38
-
39
-
40
-
41
-
42
-
43
-
44
-
45
-
46
-
47
-
48
-
49
-
50
-
51
-
52
-
53
-
54
-
55
-
56
-
57
-
58
-
59
-
60
-
61
-
62
-
 63
63 -
 64
64 -
 65
65 -
 66
66 -
 67
67 -
 68
68 -
 69
69 -
 70
70 -
 71
71 -
 72
72 -
 73
73 -
 74
74 -
 75
75 -
 76
76 -
 77
77 -
 78
78 -
 79
79 -
 80
80 -
 81
81 -
 82
82 -
 83
83 -
84
-
85
-
86
-
87
-
88
-
89
-
90
-
91
-
92
-
93
-
94
-
95
-
96
-
97
-
98
-
99
-
100
-
101
-
102
-
103
-
104
-
105
-
106
-
107
-
108
-
109
-
110
-
111
-
112
-
113
-
114
-
115
-
116
-
117
-
118
 |
 |

PITNEY BOWES INC.
NOTES TO CONSOLIDATED FINANCIAL STATEMENTS
(Tabular dollars in thousands, except per share amounts)
57
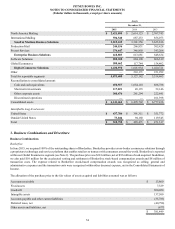
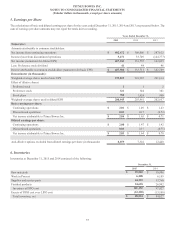
5. Earnings per Share
The calculations of basic and diluted earnings per share for the years ended December 31, 2015, 2014 and 2013 are presented below. The
sum of earnings per share amounts may not equal the totals due to rounding.
Years Ended December 31,
2015 2014 2013
Numerator:
Amounts attributable to common stockholders:
Net income from continuing operations $ 402,672 $ 300,006 $ 287,612
Income (loss) from discontinued operations 5,271 33,749 (144,777)
Net income (numerator for diluted EPS) 407,943 333,755 142,835
Less: Preference stock dividend 41 44 46
Income attributable to common stockholders (numerator for basic EPS) $ 407,902 $ 333,711 $ 142,789
Denominator (in thousands):
Weighted-average shares used in basic EPS 199,835 201,992 201,614
Effect of dilutive shares:
Preferred stock 112
Preference stock 321 344 381
Stock plans 788 1,624 960
Weighted-average shares used in diluted EPS 200,945 203,961 202,957
Basic earnings per share:
Continuing operations $ 2.01 $ 1.49 $ 1.43
Discontinued operations 0.03 0.17 (0.72)
Net income attributable to Pitney Bowes Inc. $ 2.04 $ 1.65 $ 0.71
Diluted earnings per share:
Continuing operations $ 2.00 $ 1.47 $ 1.42
Discontinued operations 0.03 0.17 (0.71)
Net income attributable to Pitney Bowes Inc. $ 2.03 $ 1.64 $ 0.70
Anti-dilutive options excluded from diluted earnings per share (in thousands): 8,079 7,322 12,448
6. Inventories
Inventories at December 31, 2015 and 2014 consisted of the following:
December 31,
2015 2014
Raw materials $ 25,803 $ 30,986
Work in Process 6,408 6,189
Supplies and service parts 44,323 33,760
Finished products 24,618 26,992
Inventory at FIFO cost 101,152 97,927
Excess of FIFO cost over LIFO cost (12,328)(13,100)
Total inventory, net $ 88,824 $ 84,827