Pitney Bowes 2015 Annual Report Download - page 83
Download and view the complete annual report
Please find page 83 of the 2015 Pitney Bowes annual report below. You can navigate through the pages in the report by either clicking on the pages listed below, or by using the keyword search tool below to find specific information within the annual report.-
 1
1 -
2
-
3
-
4
-
5
-
6
-
7
-
8
-
9
-
10
-
11
-
12
-
13
-
14
-
15
-
16
-
17
-
18
-
19
-
20
-
21
-
22
-
23
-
24
-
25
-
26
-
27
-
28
-
29
-
30
-
31
-
32
-
33
-
34
-
35
-
36
-
37
-
38
-
39
-
40
-
41
-
42
-
43
-
44
-
45
-
46
-
47
-
48
-
49
-
50
-
51
-
52
-
53
-
54
-
55
-
56
-
57
-
58
-
59
-
60
-
61
-
62
-
63
-
64
-
65
-
66
-
67
-
68
-
69
-
70
-
71
-
72
-
 73
73 -
 74
74 -
 75
75 -
 76
76 -
 77
77 -
 78
78 -
 79
79 -
 80
80 -
 81
81 -
 82
82 -
 83
83 -
 84
84 -
 85
85 -
 86
86 -
 87
87 -
 88
88 -
 89
89 -
 90
90 -
 91
91 -
 92
92 -
 93
93 -
94
-
95
-
96
-
97
-
98
-
99
-
100
-
101
-
102
-
103
-
104
-
105
-
106
-
107
-
108
-
109
-
110
-
111
-
112
-
113
-
114
-
115
-
116
-
117
-
118
 |
 |

PITNEY BOWES INC.
NOTES TO CONSOLIDATED FINANCIAL STATEMENTS
(Tabular dollars in thousands, except per share amounts)
67
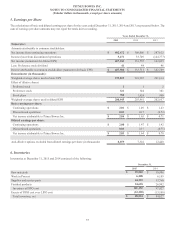
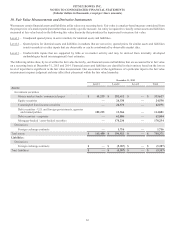
The following represents the results of our non-designated derivative instruments for the years ended December 31, 2015 and 2014:
Year Ended December 31,
Derivative Gain (Loss)
Recognized in Earnings
Derivatives Instrument Location of Derivative Gain (Loss) 2015 2014
Foreign exchange contracts Selling, general and administrative expense $(6,849)$ (4,701)
Credit-Risk-Related Contingent Features
Certain derivative instruments contain credit-risk-related contingent features that would require us to post collateral based on a combination
of our long-term senior unsecured debt ratings and the net fair value of our derivatives. At December 31, 2015, the maximum amount of
collateral that we would have been required to post had the credit-risk-related contingent features been triggered was $5 million.
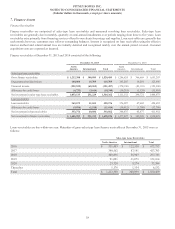
Fair Value of Financial Instruments
Our financial instruments include cash and cash equivalents, investment securities, accounts receivable, loan receivables, derivative
instruments, accounts payable and debt. The carrying value for cash and cash equivalents, accounts receivable, loans receivable, and
accounts payable approximate fair value because of the short maturity of these instruments.
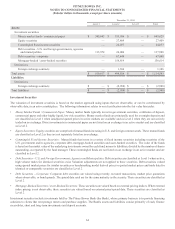
The fair value of our debt is estimated based on recently executed transactions and market price quotations. The inputs used to determine
the fair value of our debt were classified as Level 2 in the fair value hierarchy. The carrying value and estimated fair value of our debt at
December 31, 2015 and 2014 was as follows:
December 31,
2015 2014
Carrying value $ 2,968,997 $ 3,252,006
Fair value $ 3,102,890 $ 3,440,383
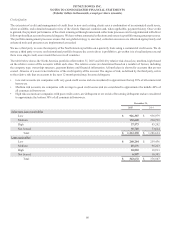
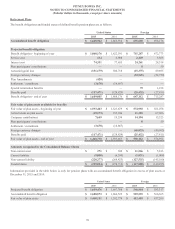
11. Supplemental Balance Sheet Information
The following table shows selected balance sheet information at December 31, 2015 and 2014:
December 31,
2015 2014
Other assets:
Long-term investments $ 327,282 $ 332,452
Deferred charges 125,190 149,092
Other 91,749 95,579
Total $ 544,221 $ 577,123
Accounts payable and accrued liabilities:
Accounts payable $ 302,113 $ 268,527
Customer deposits 665,339 661,167
Employee related liabilities 255,893 319,963
Miscellaneous other 224,976 323,314
Total $ 1,448,321 $ 1,572,971