Pitney Bowes 2015 Annual Report Download - page 41
Download and view the complete annual report
Please find page 41 of the 2015 Pitney Bowes annual report below. You can navigate through the pages in the report by either clicking on the pages listed below, or by using the keyword search tool below to find specific information within the annual report.-
 1
1 -
2
-
3
-
4
-
5
-
6
-
7
-
8
-
9
-
10
-
11
-
12
-
13
-
14
-
15
-
16
-
17
-
18
-
19
-
20
-
21
-
22
-
23
-
24
-
25
-
26
-
27
-
28
-
29
-
30
-
 31
31 -
 32
32 -
 33
33 -
 34
34 -
 35
35 -
 36
36 -
 37
37 -
 38
38 -
 39
39 -
 40
40 -
 41
41 -
 42
42 -
 43
43 -
 44
44 -
 45
45 -
 46
46 -
 47
47 -
 48
48 -
 49
49 -
 50
50 -
 51
51 -
52
-
53
-
54
-
55
-
56
-
57
-
58
-
59
-
60
-
61
-
62
-
63
-
64
-
65
-
66
-
67
-
68
-
69
-
70
-
71
-
72
-
73
-
74
-
75
-
76
-
77
-
78
-
79
-
80
-
81
-
82
-
83
-
84
-
85
-
86
-
87
-
88
-
89
-
90
-
91
-
92
-
93
-
94
-
95
-
96
-
97
-
98
-
99
-
100
-
101
-
102
-
103
-
104
-
105
-
106
-
107
-
108
-
109
-
110
-
111
-
112
-
113
-
114
-
115
-
116
-
117
-
118
 |
 |

25
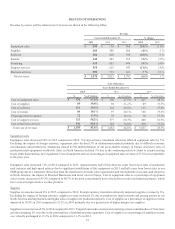
LIQUIDITY AND CAPITAL RESOURCES
We believe that existing cash and investments, cash generated from operations and borrowing capacity under our commercial paper
program will be sufficient to support our current cash needs, including discretionary uses such as capital investments, dividends, share
repurchases and acquisitions. Cash and cash equivalents and short-term investments were $768 million at December 31, 2015 and $1,103
million at December 31, 2014. We continuously review our credit profile through published credit ratings and the credit default swap
market. We also monitor the creditworthiness of those banks acting as derivative counterparties, depository banks or credit providers.
Cash and cash equivalents held by our foreign subsidiaries were $470 million at both December 31, 2015 and December 31, 2014. Cash
and cash equivalents held by our foreign subsidiaries are generally used to support the liquidity needs of these subsidiaries. Most of
these amounts could be repatriated to the U.S. but would be subject to additional taxes. Repatriation of some foreign balances is restricted
by local laws.
Cash Flow Summary
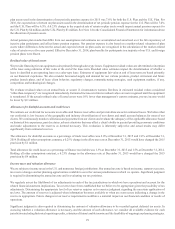
The change in cash and cash equivalents is as follows:
Years Ended December 31, Change
2015 2014 2013 2015 2014
Net cash provided by operating activities $ 514 $ 655 $ 625 $(141)$30
Net cash (used in) provided by investing activities (303)(147) 241 (156)(388)
Net cash used in financing activities (571)(312)(868)(259)556
Effect of exchange rate changes on cash and cash equivalents (44)(29)(13)(15)(16)
Change in cash and cash equivalents $(404)$ 167 $ (15)$(571)$ 182
Cash flows from operations decreased $141 million in 2015 compared to 2014, primarily due to the timing of payments of accounts
payable and accrued liabilities including, higher employee-related payments, and higher inventory purchases, primarily for parts and
supplies in the U.S. and U.K., lower collections of accounts receivable due to timing and amounts received in the prior year for transition
services in connection with the sale of our Management Services business. These decreases were partially offset by lower interest and
tax payments.
Cash flows from operations increased $30 million in 2014 compared to 2013, primarily due to higher income and lower tax and interest
payments partially offset by higher cash payments related to the early repayment of debt and changes in working capital accounts, primarily
due to lower cash flows from changes in inventory and accounts receivable. Cash management initiatives implemented in 2013 significantly
improved working capital and cash flows from operations. In 2014, we continued to see benefits from changes in accounts receivable
and inventory; however, the benefits were not as dramatic as in 2013. The timing of payments for accounts payables and accrued liabilities
partially offset these reductions in cash flow from working capital.
Cash flows used by investing activities were $156 million higher in 2015 compared to 2014. In 2015, we paid $394 million for acquisitions,
purchased short term investments of $69 million, received proceeds of $292 million from the sale of Imagitas and $52 million from the
sale of our former corporate headquarters building and other assets. During 2014, we received proceeds of $102 million from the sale of
businesses.
Cash flows from investing activities were $388 million lower in 2014 compared to 2013. In 2014, we received $102 million from the
sale of businesses compared to $390 million in 2013. Higher cash outflows of $48 million for the purchase of available for sale investments
and $43 million of higher capital expenditures primarily due to spending on our global ERP system also contributed to the decrease in
cash flows from investing activities in 2014.
Cash flows used in financing activities increased $259 million in 2015 due to higher net payments to reduce debt and higher stock
repurchases in 2015. During 2015, we reduced total debt by $275 million and repurchased $132 million of our common shares compared
to a net reduction in total debt of $91 million and share repurchases of $50 million in 2014. Cash flows from financing activities increased
$556 million in 2014 due to the timing of debt activity. See Financing and Capitalization section below for a detailed discussion of our
debt activity for 2015, 2014 and 2013.