Pitney Bowes 2015 Annual Report Download - page 105
Download and view the complete annual report
Please find page 105 of the 2015 Pitney Bowes annual report below. You can navigate through the pages in the report by either clicking on the pages listed below, or by using the keyword search tool below to find specific information within the annual report.-
 1
1 -
2
-
3
-
4
-
5
-
6
-
7
-
8
-
9
-
10
-
11
-
12
-
13
-
14
-
15
-
16
-
17
-
18
-
19
-
20
-
21
-
22
-
23
-
24
-
25
-
26
-
27
-
28
-
29
-
30
-
31
-
32
-
33
-
34
-
35
-
36
-
37
-
38
-
39
-
40
-
41
-
42
-
43
-
44
-
45
-
46
-
47
-
48
-
49
-
50
-
51
-
52
-
53
-
54
-
55
-
56
-
57
-
58
-
59
-
60
-
61
-
62
-
63
-
64
-
65
-
66
-
67
-
68
-
69
-
70
-
71
-
72
-
73
-
74
-
75
-
76
-
77
-
78
-
79
-
80
-
81
-
82
-
83
-
84
-
85
-
86
-
87
-
88
-
89
-
90
-
91
-
92
-
93
-
94
-
 95
95 -
 96
96 -
 97
97 -
 98
98 -
 99
99 -
 100
100 -
 101
101 -
 102
102 -
 103
103 -
 104
104 -
 105
105 -
 106
106 -
 107
107 -
 108
108 -
 109
109 -
 110
110 -
 111
111 -
 112
112 -
 113
113 -
 114
114 -
 115
115 -
116
-
117
-
118
 |
 |

PITNEY BOWES INC.
NOTES TO CONSOLIDATED FINANCIAL STATEMENTS
(Tabular dollars in thousands, except per share amounts)
89
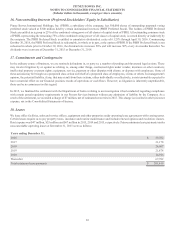
Employee Stock Purchase Plan
We maintain a non-compensatory Employee Stock Purchase Plan that enables substantially all U.S. and Canadian employees to purchase
shares of our common stock at an offering price of 95% of the average market price on the offering date. At no time will the exercise
price be less than the lowest price permitted under Section 423 of the Internal Revenue Code. Employees purchased 131,769 shares and
87,606 shares in 2015 and 2014, respectively. We have reserved 3,068,737 common shares for future purchase under the ESPP.
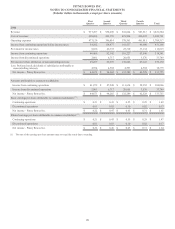
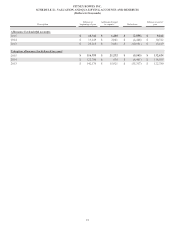
22. Quarterly Financial Data (unaudited)
First
Quarter
Second
Quarter
Third
Quarter
Fourth
Quarter Total
2015
Revenue $ 890,681 $ 880,891 $ 869,541 $ 936,947 $ 3,578,060
Cost of revenues 390,525 385,182 376,205 406,679 1,558,591
Operating expenses 364,560 286,256 356,784 401,044 1,408,644
Income from continuing operations before income taxes 135,596 209,453 136,552 129,224 610,825
Provision for income taxes 50,547 52,351 42,676 44,204 189,778
Income from continuing operations 85,049 157,102 93,876 85,020 421,047
Income (loss) from discontinued operations 157 (739) — 5,853 5,271
Net income before attribution of noncontrolling interests 85,206 156,363 93,876 90,873 426,318
Less: Preferred stock dividends of subsidiaries attributable to
noncontrolling interests 4,594 4,593 4,594 4,594 18,375
Net income - Pitney Bowes Inc. $ 80,612 $ 151,770 $ 89,282 $ 86,279 $ 407,943
Amounts attributable to common stockholders:
Income from continuing operations $ 80,455 $ 152,509 $ 89,282 $ 80,426 $ 402,672
Income (loss) from discontinued operations 157 (739) — 5,853 5,271
Net income - Pitney Bowes Inc. $ 80,612 $ 151,770 $ 89,282 $ 86,279 $ 407,943
Basic earnings per share attributable to common stockholders (1):
Continuing operations $ 0.40 $ 0.76 $ 0.45 $ 0.40 $ 2.01
Discontinued operations — — — 0.03 0.03
Net income - Pitney Bowes Inc. $ 0.40 $ 0.75 $ 0.45 $ 0.43 $ 2.04
Diluted earnings per share attributable to common stockholders (1):
Continuing operations $ 0.40 $ 0.75 $ 0.44 $ 0.41 $ 2.00
Discontinued operations — — — 0.03 0.03
Net income - Pitney Bowes Inc. $ 0.40 $ 0.75 $ 0.44 $ 0.44 $ 2.03
(1) The sum of the earnings per share amounts may not equal the totals due to rounding.