Pitney Bowes 2015 Annual Report Download - page 81
Download and view the complete annual report
Please find page 81 of the 2015 Pitney Bowes annual report below. You can navigate through the pages in the report by either clicking on the pages listed below, or by using the keyword search tool below to find specific information within the annual report.-
 1
1 -
2
-
3
-
4
-
5
-
6
-
7
-
8
-
9
-
10
-
11
-
12
-
13
-
14
-
15
-
16
-
17
-
18
-
19
-
20
-
21
-
22
-
23
-
24
-
25
-
26
-
27
-
28
-
29
-
30
-
31
-
32
-
33
-
34
-
35
-
36
-
37
-
38
-
39
-
40
-
41
-
42
-
43
-
44
-
45
-
46
-
47
-
48
-
49
-
50
-
51
-
52
-
53
-
54
-
55
-
56
-
57
-
58
-
59
-
60
-
61
-
62
-
63
-
64
-
65
-
66
-
67
-
68
-
69
-
70
-
 71
71 -
 72
72 -
 73
73 -
 74
74 -
 75
75 -
 76
76 -
 77
77 -
 78
78 -
 79
79 -
 80
80 -
 81
81 -
 82
82 -
 83
83 -
 84
84 -
 85
85 -
 86
86 -
 87
87 -
 88
88 -
 89
89 -
 90
90 -
 91
91 -
92
-
93
-
94
-
95
-
96
-
97
-
98
-
99
-
100
-
101
-
102
-
103
-
104
-
105
-
106
-
107
-
108
-
109
-
110
-
111
-
112
-
113
-
114
-
115
-
116
-
117
-
118
 |
 |

PITNEY BOWES INC.
NOTES TO CONSOLIDATED FINANCIAL STATEMENTS
(Tabular dollars in thousands, except per share amounts)
65
The Bank's investment securities are classified as available-for-sale and recorded at fair value in the Consolidated Balance Sheets as cash
and cash equivalents, short-term investments and other assets depending on the type of investment and maturity. Unrealized holding gains
and losses are recorded in accumulated other comprehensive income (AOCI), net of tax.
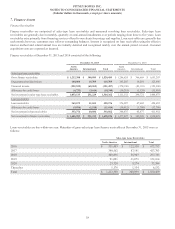
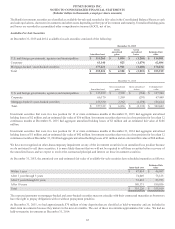
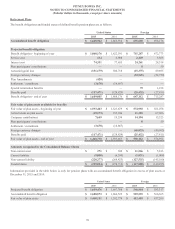
Available-For-Sale Securities
At December 31, 2015 and 2014, available-for-sale securities consisted of the following:
December 31, 2015
Amortized cost
Gross
unrealized
gains
Gross
unrealized
losses
Estimated fair
value
U.S. and foreign governments, agencies and municipalities $ 114,265 $ 1,804 $ (1,268) $ 114,801
Corporate 63,140 823 (1,079) 62,884
Mortgage-backed / asset-backed securities 177,821 1,901 (1,488) 178,234
Total $ 355,226 $ 4,528 $ (3,835) $ 355,919
December 31, 2014
Amortized cost
Gross unrealized
gains
Gross unrealized
losses
Estimated fair
value
U.S. and foreign governments, agencies and municipalities $ 135,839 $ 2,905 $ (764) $ 137,980
Corporate 66,170 1,569 (291) 67,448
Mortgage-backed / asset-backed securities 155,330 2,362 (1,078) 156,614
Total $ 357,339 $ 6,836 $ (2,133) $ 362,042
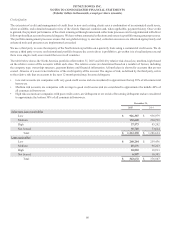
Investment securities that were in a loss position for 12 or more continuous months at December 31, 2015 had aggregate unrealized
holding losses of $2 million and an estimated fair value of $36 million. Investment securities that were in a loss position for less than 12
continuous months at December 31, 2015 had aggregate unrealized holding losses of $2 million and an estimated fair value of $146
million.
Investment securities that were in a loss position for 12 or more continuous months at December 31, 2014 had aggregate unrealized
holding losses of $1 million and an estimated fair value of $42 million. Investment securities that were in a loss position for less than 12
continuous months at December 31, 2014 had aggregate unrealized holding losses of $1 million and an estimated fair value of $88 million.
We have not recognized an other-than-temporary impairment on any of the investment securities in an unrealized loss position because
we do not intend to sell these securities, it is more likely than not that we will not be required to sell these securities before recovery of
the unrealized losses and we expect to receive the contractual principal and interest on these investment securities.
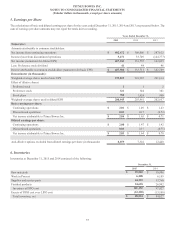
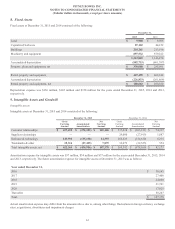
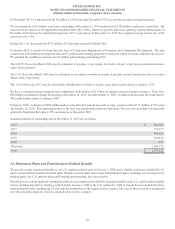
At December 31, 2015, the amortized cost and estimated fair value of available-for-sale securities have scheduled maturities as follows:
Amortized cost
Estimated fair
value
Within 1 year $ 47,014 $ 46,987
After 1 year through 5 years 74,649 75,123
After 5 years through 10 years 53,432 53,753
After 10 years 180,131 180,056
Total $ 355,226 $ 355,919
The expected payments on mortgage-backed and asset-backed securities may not coincide with their contractual maturities as borrowers
have the right to prepay obligations with or without prepayment penalties.
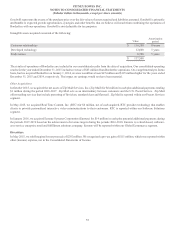
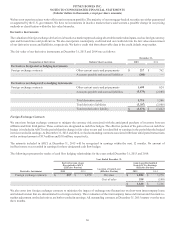
At December 31, 2015, we had approximately $70 million of time deposits that are classified as held-to-maturity and are included in
short-term investments because they mature in the next six months. The cost of these investments approximates fair value. We had no
held-to-maturity investments at December 31, 2014.