Pitney Bowes 2015 Annual Report Download - page 59
Download and view the complete annual report
Please find page 59 of the 2015 Pitney Bowes annual report below. You can navigate through the pages in the report by either clicking on the pages listed below, or by using the keyword search tool below to find specific information within the annual report.-
 1
1 -
2
-
3
-
4
-
5
-
6
-
7
-
8
-
9
-
10
-
11
-
12
-
13
-
14
-
15
-
16
-
17
-
18
-
19
-
20
-
21
-
22
-
23
-
24
-
25
-
26
-
27
-
28
-
29
-
30
-
31
-
32
-
33
-
34
-
35
-
36
-
37
-
38
-
39
-
40
-
41
-
42
-
43
-
44
-
45
-
46
-
47
-
48
-
 49
49 -
 50
50 -
 51
51 -
 52
52 -
 53
53 -
 54
54 -
 55
55 -
 56
56 -
 57
57 -
 58
58 -
 59
59 -
 60
60 -
 61
61 -
 62
62 -
 63
63 -
 64
64 -
 65
65 -
 66
66 -
 67
67 -
 68
68 -
 69
69 -
70
-
71
-
72
-
73
-
74
-
75
-
76
-
77
-
78
-
79
-
80
-
81
-
82
-
83
-
84
-
85
-
86
-
87
-
88
-
89
-
90
-
91
-
92
-
93
-
94
-
95
-
96
-
97
-
98
-
99
-
100
-
101
-
102
-
103
-
104
-
105
-
106
-
107
-
108
-
109
-
110
-
111
-
112
-
113
-
114
-
115
-
116
-
117
-
118
 |
 |

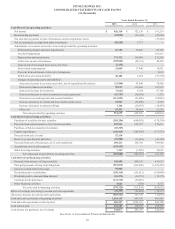
PITNEY BOWES INC.
CONSOLIDATED STATEMENTS OF CASH FLOWS
(In thousands)
43
Years Ended December 31,
2015 2014 2013
Cash flows from operating activities:
Net income $ 426,318 $ 352,130 $ 161,210
Restructuring payments (62,086) (56,162) (59,520)
Tax and other payments on sale of businesses and leveraged lease assets —— (75,545)
Net tax (payments) receipts from other investments (20,602) 5,737 —
Adjustments to reconcile net income to net cash provided by operating activities:
Restructuring charges and asset impairments 25,782 83,466 86,175
Goodwill impairment —— 101,415
Depreciation and amortization 173,312 198,088 211,243
(Gain) loss on sale of businesses (105,826) (28,151) 42,450
Gain on sale of leveraged lease assets, net of tax (2,152) ——
Stock-based compensation 21,049 17,446 14,921
Proceeds from settlement of derivative instruments —— 8,059
Deferred tax provision (benefit) 40,184 1,454 (33,770)
Changes in operating assets and liabilities:
(Increase) decrease in accounts receivable, net of acquisitions/divestitures (13,844) 45,046 58,980
Decrease in finance receivables 96,611 119,668 123,587
(Increase) decrease in inventories (7,621) 9,104 67,188
(Increase) decrease in other current assets and prepayments (10,787) (10,106) 3,172
Decrease in accounts payable and accrued liabilities (111,953) (51,080) (95,843)
Increase (decrease) in current and non-current income taxes 21,567 (52,080) 6,322
Increase (decrease) in advance billings 1,344 (18,695) (16,450)
Other, net 43,343 39,661 21,230
Net cash provided by operating activities 514,639 655,526 624,824
Cash flows from investing activities:
Purchases of available-for-sale securities (205,256) (680,582) (374,230)
Proceeds from sales/maturities of investment securities 207,063 628,727 370,631
Purchases of held-to-maturity investments (69,329) ——
Capital expenditures (166,329) (180,556) (137,512)
Proceeds from sale of assets 52,110 ——
Reserve account deposits and other (24,202) (15,666) (20,104)
Proceeds from sale of businesses, net of cash transferred 289,211 102,392 389,680
Acquisitions, net of cash acquired (393,695) ——
Other investing activities 7,339 (1,585) 12,691
Net cash (used in) provided by investing activities (303,088) (147,270) 241,156
Cash flows from financing activities:
Proceeds from issuance of long-term debt 150,950 508,525 411,613
Principal payments of long-term obligations (516,070) (599,850) (1,079,207)
Increase in short-term borrowings 90,000 ——
Dividends paid to stockholders (150,114) (151,611) (188,846)
Dividends paid to noncontrolling interests (18,375) (18,375) (18,375)
Common stock repurchases (131,719) (50,003) —
Other financing activities 4,603 (530) 6,753
Net cash used in financing activities (570,725) (311,844) (868,062)
Effect of exchange rate changes on cash and cash equivalents (44,387) (29,082) (12,973)
(Decrease) increase in cash and cash equivalents (403,561) 167,330 (15,055)
Cash and cash equivalents at beginning of period 1,054,118 886,788 901,843
Cash and cash equivalents at end of period $ 650,557 $ 1,054,118 $ 886,788
Cash interest paid $ 165,287 $ 180,250 $ 199,505
Cash income tax payments, net of refunds $ 138,877 $ 203,193 $ 224,432
See Notes to Consolidated Financial Statements