Pitney Bowes 2015 Annual Report Download - page 79
Download and view the complete annual report
Please find page 79 of the 2015 Pitney Bowes annual report below. You can navigate through the pages in the report by either clicking on the pages listed below, or by using the keyword search tool below to find specific information within the annual report.-
 1
1 -
2
-
3
-
4
-
5
-
6
-
7
-
8
-
9
-
10
-
11
-
12
-
13
-
14
-
15
-
16
-
17
-
18
-
19
-
20
-
21
-
22
-
23
-
24
-
25
-
26
-
27
-
28
-
29
-
30
-
31
-
32
-
33
-
34
-
35
-
36
-
37
-
38
-
39
-
40
-
41
-
42
-
43
-
44
-
45
-
46
-
47
-
48
-
49
-
50
-
51
-
52
-
53
-
54
-
55
-
56
-
57
-
58
-
59
-
60
-
61
-
62
-
63
-
64
-
65
-
66
-
67
-
68
-
 69
69 -
 70
70 -
 71
71 -
 72
72 -
 73
73 -
 74
74 -
 75
75 -
 76
76 -
 77
77 -
 78
78 -
 79
79 -
 80
80 -
 81
81 -
 82
82 -
 83
83 -
 84
84 -
 85
85 -
 86
86 -
 87
87 -
 88
88 -
 89
89 -
90
-
91
-
92
-
93
-
94
-
95
-
96
-
97
-
98
-
99
-
100
-
101
-
102
-
103
-
104
-
105
-
106
-
107
-
108
-
109
-
110
-
111
-
112
-
113
-
114
-
115
-
116
-
117
-
118
 |
 |

PITNEY BOWES INC.
NOTES TO CONSOLIDATED FINANCIAL STATEMENTS
(Tabular dollars in thousands, except per share amounts)
63
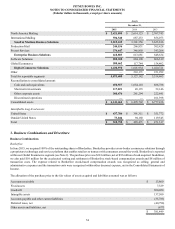
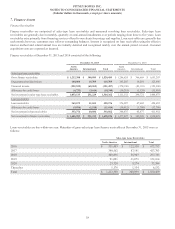
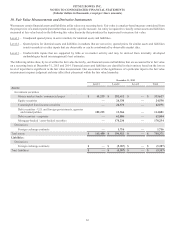
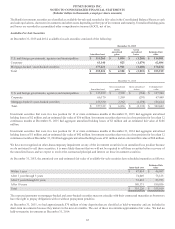
10. Fair Value Measurements and Derivative Instruments
We measure certain financial assets and liabilities at fair value on a recurring basis. Fair value is a market-based measure considered from
the perspective of a market participant rather than an entity-specific measure. An entity is required to classify certain assets and liabilities
measured at fair value based on the following fair value hierarchy that prioritizes the inputs used to measure fair value:
Level 1 – Unadjusted quoted prices in active markets for identical assets and liabilities.
Level 2 – Quoted prices for identical assets and liabilities in markets that are not active, quoted prices for similar assets and liabilities
in active markets or other inputs that are observable or can be corroborated by observable market data.
Level 3 – Unobservable inputs that are supported by little or no market activity and may be derived from internally developed
methodologies based on management's best estimates.
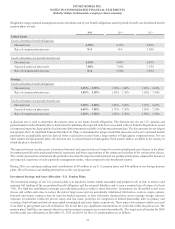
The following tables show, by level within the fair value hierarchy, our financial assets and liabilities that are accounted for at fair value
on a recurring basis at December 31, 2015 and 2014. Financial assets and liabilities are classified in their entirety based on the lowest
level of input that is significant to the fair value measurement. Our assessment of the significance of a particular input to the fair value
measurement requires judgment and may affect their placement within the fair value hierarchy.
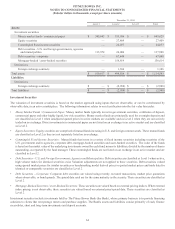
December 31, 2015
Level 1 Level 2 Level 3 Total
Assets:
Investment securities
Money market funds / commercial paper $ 41,215 $ 292,412 $ — $ 333,627
Equity securities — 24,538 — 24,538
Commingled fixed income securities — 22,571 — 22,571
Debt securities - U.S. and foreign governments, agencies
and municipalities 102,235 12,566 — 114,801
Debt securities - corporate — 62,884 — 62,884
Mortgage-backed / asset-backed securities — 178,234 — 178,234
Derivatives
Foreign exchange contracts — 1,716 — 1,716
Total assets $ 143,450 $ 594,921 $ — $ 738,371
Liabilities:
Derivatives
Foreign exchange contracts $—$
(5,387) $ — $ (5,387)
Total liabilities $—$
(5,387) $ — $ (5,387)