Pitney Bowes 2015 Annual Report Download - page 77
Download and view the complete annual report
Please find page 77 of the 2015 Pitney Bowes annual report below. You can navigate through the pages in the report by either clicking on the pages listed below, or by using the keyword search tool below to find specific information within the annual report.-
 1
1 -
2
-
3
-
4
-
5
-
6
-
7
-
8
-
9
-
10
-
11
-
12
-
13
-
14
-
15
-
16
-
17
-
18
-
19
-
20
-
21
-
22
-
23
-
24
-
25
-
26
-
27
-
28
-
29
-
30
-
31
-
32
-
33
-
34
-
35
-
36
-
37
-
38
-
39
-
40
-
41
-
42
-
43
-
44
-
45
-
46
-
47
-
48
-
49
-
50
-
51
-
52
-
53
-
54
-
55
-
56
-
57
-
58
-
59
-
60
-
61
-
62
-
63
-
64
-
65
-
66
-
 67
67 -
 68
68 -
 69
69 -
 70
70 -
 71
71 -
 72
72 -
 73
73 -
 74
74 -
 75
75 -
 76
76 -
 77
77 -
 78
78 -
 79
79 -
 80
80 -
 81
81 -
 82
82 -
 83
83 -
 84
84 -
 85
85 -
 86
86 -
 87
87 -
88
-
89
-
90
-
91
-
92
-
93
-
94
-
95
-
96
-
97
-
98
-
99
-
100
-
101
-
102
-
103
-
104
-
105
-
106
-
107
-
108
-
109
-
110
-
111
-
112
-
113
-
114
-
115
-
116
-
117
-
118
 |
 |

PITNEY BOWES INC.
NOTES TO CONSOLIDATED FINANCIAL STATEMENTS
(Tabular dollars in thousands, except per share amounts)
61
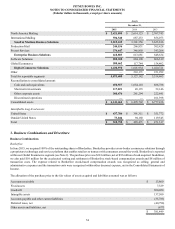
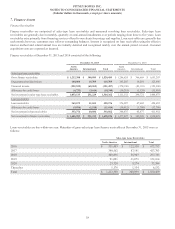
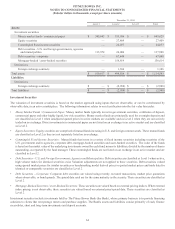
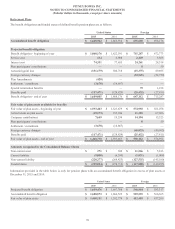
8. Fixed Assets
Fixed assets at December 31, 2015 and 2014 consisted of the following:
December 31,
2015 2014
Land $ 9,908 $ 9,908
Capitalized Software 87,102 44,152
Buildings 218,261 213,196
Machinery and equipment 897,532 879,222
1,212,803 1,146,478
Accumulated depreciation (882,715)(861,387)
Property, plant and equipment, net $ 330,088 $ 285,091
Rental property and equipment $ 407,495 $ 462,244
Accumulated depreciation (226,833)(261,864)
Rental property and equipment, net $ 180,662 $ 200,380
Depreciation expense was $136 million, $165 million and $158 million for the years ended December 31, 2015, 2014 and 2013,
respectively.
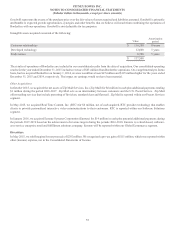
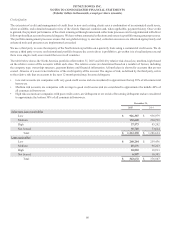
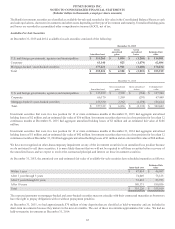
9. Intangible Assets and Goodwill
Intangible assets
Intangible assets at December 31, 2015 and 2014 consisted of the following:
December 31, 2015 December 31, 2014
Gross
Carrying
Amount
Accumulated
Amortization
Net
Carrying
Amount
Gross
Carrying
Amount
Accumulated
Amortization
Net
Carrying
Amount
Customer relationships $ 437,459 $ (272,353) $ 165,106 $ 337,438 $ (263,121) $ 74,317
Supplier relationships ———
29,000 (27,913) 1,087
Software & technology 149,591 (135,198) 14,393 160,825 (154,610) 6,215
Trademarks & other 35,314 (27,435) 7,879 33,079 (32,525) 554
Total intangible assets, net $ 622,364 $ (434,986) $ 187,378 $ 560,342 $ (478,169) $ 82,173
Amortization expense for intangible assets was $37 million, $34 million and $37 million for the years ended December 31, 2015, 2014
and 2013, respectively. The future amortization expense for intangible assets at December 31, 2015 was as follows:
Year ended December 31,
2016 $ 38,165
2017 27,400
2018 24,800
2019 21,741
2020 17,025
Thereafter 58,247
Total $ 187,378
Actual amortization expense may differ from the amounts above due to, among other things, fluctuations in foreign currency exchange
rates, acquisitions, divestitures and impairment charges.