Pitney Bowes 2015 Annual Report Download - page 30
Download and view the complete annual report
Please find page 30 of the 2015 Pitney Bowes annual report below. You can navigate through the pages in the report by either clicking on the pages listed below, or by using the keyword search tool below to find specific information within the annual report.-
 1
1 -
2
-
3
-
4
-
5
-
6
-
7
-
8
-
9
-
10
-
11
-
12
-
13
-
14
-
15
-
16
-
17
-
18
-
19
-
 20
20 -
 21
21 -
 22
22 -
 23
23 -
 24
24 -
 25
25 -
 26
26 -
 27
27 -
 28
28 -
 29
29 -
 30
30 -
 31
31 -
 32
32 -
 33
33 -
 34
34 -
 35
35 -
 36
36 -
 37
37 -
 38
38 -
 39
39 -
 40
40 -
41
-
42
-
43
-
44
-
45
-
46
-
47
-
48
-
49
-
50
-
51
-
52
-
53
-
54
-
55
-
56
-
57
-
58
-
59
-
60
-
61
-
62
-
63
-
64
-
65
-
66
-
67
-
68
-
69
-
70
-
71
-
72
-
73
-
74
-
75
-
76
-
77
-
78
-
79
-
80
-
81
-
82
-
83
-
84
-
85
-
86
-
87
-
88
-
89
-
90
-
91
-
92
-
93
-
94
-
95
-
96
-
97
-
98
-
99
-
100
-
101
-
102
-
103
-
104
-
105
-
106
-
107
-
108
-
109
-
110
-
111
-
112
-
113
-
114
-
115
-
116
-
117
-
118
 |
 |

14
Share Repurchases
We may periodically repurchase shares of our common stock to manage the dilution created by shares issued under employee stock plans
and for other purposes. For the full year 2015, we repurchased 6,655,196 shares of our common stock at an average share price of $20.35.
The following table provides information about our purchases of our common stock during the three months ended December 31, 2015:
Number of
shares purchased
Average price
paid per share
Number of
shares
purchased
as part of a
publicly
announced plan
Approximate
dollar value of
shares that may
be purchased
under the plan (in
thousands) (1)
Beginning balance
$100,000
October 2015 — — — $100,000
November 2015 — — — $100,000
December 2015 1,744,600 $ 20.31 1,744,600 $64,567
1,744,600 $ 20.31 1,744,600
(1) In September 2015, we received authorization from our Board of Directors to repurchase $100 million of our common stock. The
plan does not have an expiration date.
In February 2016, we received authorization from our Board of Directors to repurchase an additional $150 million of outstanding stock.
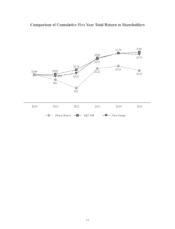
Stock Performance Graph
Our peer group is comprised of: Alliance Data Systems Corporation, Diebold, Incorporated, DST Systems Inc., EchoStar Corp., Fidelity
National Information Services, Inc., Fiserv, Inc., Harris Corporation, Iron Mountain Inc., Lexmark International Inc., NCR Corp., Pitney
Bowes Inc., R.R. Donnelley & Sons Company, Rockwell Automation Inc., Unisys Corporation, The Western Union Company and Xerox
Corporation.
The accompanying graph shows the annual changes for the five-year period based on the assumption that $100 was invested in Pitney
Bowes, the Standard and Poor's (S&P) 500 Composite Index and our peer group, and that all dividends were reinvested. On a total return
basis, $100 invested in Pitney Bowes, the S&P 500 Composite Index and our peer group on December 31, 2010 would have been worth
$115, $181, $173, respectively, on December 31, 2015.
All information is based upon data independently provided to us by Standard & Poor's Corporation and is derived from their official total
return calculation. Total return for the S&P 500 Composite Index and each peer group is based on market capitalization, weighted for
each year. The stock price performance is not necessarily indicative of future stock price performance.