Pitney Bowes 2013 Annual Report Download - page 98
Download and view the complete annual report
Please find page 98 of the 2013 Pitney Bowes annual report below. You can navigate through the pages in the report by either clicking on the pages listed below, or by using the keyword search tool below to find specific information within the annual report.-
 1
1 -
2
-
3
-
4
-
5
-
6
-
7
-
8
-
9
-
10
-
11
-
12
-
13
-
14
-
15
-
16
-
17
-
18
-
19
-
20
-
21
-
22
-
23
-
24
-
25
-
26
-
27
-
28
-
29
-
30
-
31
-
32
-
33
-
34
-
35
-
36
-
37
-
38
-
39
-
40
-
41
-
42
-
43
-
44
-
45
-
46
-
47
-
48
-
49
-
50
-
51
-
52
-
53
-
54
-
55
-
56
-
57
-
58
-
59
-
60
-
61
-
62
-
63
-
64
-
65
-
66
-
67
-
68
-
69
-
70
-
71
-
72
-
73
-
74
-
75
-
76
-
77
-
78
-
79
-
80
-
81
-
82
-
83
-
84
-
85
-
86
-
87
-
 88
88 -
 89
89 -
 90
90 -
 91
91 -
 92
92 -
 93
93 -
 94
94 -
 95
95 -
 96
96 -
 97
97 -
 98
98 -
 99
99 -
 100
100 -
 101
101 -
 102
102 -
 103
103 -
 104
104 -
 105
105 -
 106
106 -
 107
107 -
 108
108 -
109
-
110
-
111
-
112
-
113
-
114
-
115
-
116
 |
 |

PITNEY BOWES INC.
NOTES TO CONSOLIDATED FINANCIAL STATEMENTS
(Tabular dollars in thousands, except per share amounts)
87
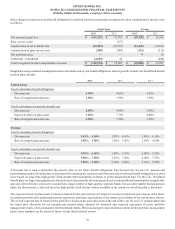
The assumed health care cost trend rate used in measuring the accumulated postretirement benefit obligation for the U.S. plan was 7.0%
for 2013 and 7.5% for 2012. The assumed health care trend rate is 6.5% for 2014 and will gradually decline to 5.0% by the year 2017
and remain at that level thereafter. Assumed health care cost trend rates have a significant effect on the amounts reported for the health
care plans. A 1% change in the assumed health care cost trend rates would have the following effects:
1% Increase 1% Decrease
Effect on total of service and interest cost components $ 517 $ (451)
Effect on postretirement benefit obligation $ 8,284 $ (7,662)
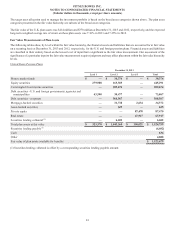
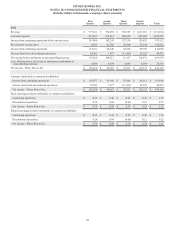
Estimated Future Benefit Payments
Benefit payments expected to be paid, which reflect expected future service, are shown in the table below. Nonpension benefit payments
are net of expected Medicare Part D subsidy.
Pension Benefits
Nonpension
Benefits
Years ending December 31,
2014 $ 166,952 $ 23,669
2015 125,225 22,570
2016 124,045 21,561
2017 127,236 20,612
2018 128,739 19,708
2019 - 2022 673,039 87,457
$ 1,345,236 $ 195,577
Savings Plans
We offer voluntary defined contribution plans to our U.S. employees designed to help them accumulate additional savings for retirement.
We provide a core contribution to all employees, regardless if they participate in the plan, and match a portion of each participating
employees' contribution, based on eligible pay. Total contributions to our defined contribution plans were $32 million in 2013 and $30
million in 2012.