Pitney Bowes 2013 Annual Report Download - page 70
Download and view the complete annual report
Please find page 70 of the 2013 Pitney Bowes annual report below. You can navigate through the pages in the report by either clicking on the pages listed below, or by using the keyword search tool below to find specific information within the annual report.-
 1
1 -
2
-
3
-
4
-
5
-
6
-
7
-
8
-
9
-
10
-
11
-
12
-
13
-
14
-
15
-
16
-
17
-
18
-
19
-
20
-
21
-
22
-
23
-
24
-
25
-
26
-
27
-
28
-
29
-
30
-
31
-
32
-
33
-
34
-
35
-
36
-
37
-
38
-
39
-
40
-
41
-
42
-
43
-
44
-
45
-
46
-
47
-
48
-
49
-
50
-
51
-
52
-
53
-
54
-
55
-
56
-
57
-
58
-
59
-
 60
60 -
 61
61 -
 62
62 -
 63
63 -
 64
64 -
 65
65 -
 66
66 -
 67
67 -
 68
68 -
 69
69 -
 70
70 -
 71
71 -
 72
72 -
 73
73 -
 74
74 -
 75
75 -
 76
76 -
 77
77 -
 78
78 -
 79
79 -
 80
80 -
81
-
82
-
83
-
84
-
85
-
86
-
87
-
88
-
89
-
90
-
91
-
92
-
93
-
94
-
95
-
96
-
97
-
98
-
99
-
100
-
101
-
102
-
103
-
104
-
105
-
106
-
107
-
108
-
109
-
110
-
111
-
112
-
113
-
114
-
115
-
116
 |
 |

PITNEY BOWES INC.
NOTES TO CONSOLIDATED FINANCIAL STATEMENTS
(Tabular dollars in thousands, except per share amounts)
59
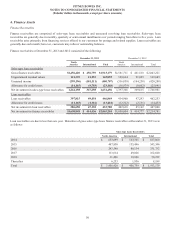
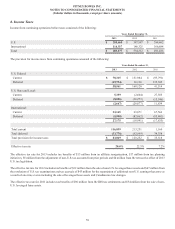
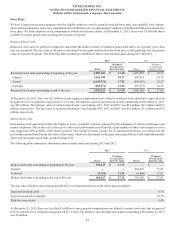
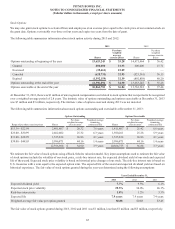
The items accounting for the difference between income taxes computed at the federal statutory rate and our provision for income taxes
consist of the following:
Years Ended December 31,
2013 2012 2011
Federal statutory provision $ 141,118 $ 187,009 $ 172,020
State and local income taxes (1,733)(2,071) 12,079
Impact of non-U.S. leveraged lease asset sales —(30,367) (31,423)
Other impact of foreign operations (29,865)21,100 (13,337)
Tax exempt income/reimbursement (1,672)(1,992) (2,674)
Federal income tax credits/incentives (10,282)(8,918) (10,741)
Unrealized stock compensation benefits 2,292 3,456 3,538
Resolution of U.S. tax examinations (3,853)(47,380) (94,225)
Outside basis differences (13,214)——
Other, net 278 (585) 281
Provision for income taxes $ 83,069 $ 120,252 $ 35,518
Other impacts of foreign operations include income of foreign affiliates taxed at rates other than the 35% U.S. statutory rate, the accrual
or release of tax uncertainty amounts related to foreign operations, the tax impacts of foreign earnings repatriation and the U.S. foreign
tax credit impacts of other foreign income taxed in the U.S.
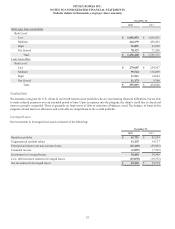
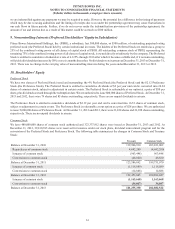
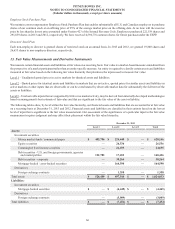
Deferred tax liabilities and assets consisted of the following:
December 31,
2013 2012
Deferred tax liabilities:
Depreciation $(54,023)$ (65,205)
Deferred profit (for tax purposes) on sale to finance subsidiary (142,114)(157,279)
Lease revenue and related depreciation (249,998)(306,612)
Amortizable intangibles (79,852)(104,156)
Other (73,077)(35,157)
Deferred tax liabilities (599,064)(668,409)
Deferred tax assets:
Nonpension postretirement benefits 99,628 119,002
Pension 43,301 117,509
Inventory and equipment capitalization 22,824 26,778
Restructuring charges 26,837 20,793
Long-term incentives 28,880 35,056
Net operating loss 143,839 152,617
Tax credit carry forwards 48,617 41,518
Tax uncertainties gross-up 35,298 28,492
Other 147,709 89,406
Valuation allowance (122,780)(142,176)
Deferred tax assets 474,153 488,995
Total deferred taxes, net $(124,911)$ (179,414)