Pitney Bowes 2013 Annual Report Download - page 81
Download and view the complete annual report
Please find page 81 of the 2013 Pitney Bowes annual report below. You can navigate through the pages in the report by either clicking on the pages listed below, or by using the keyword search tool below to find specific information within the annual report.-
 1
1 -
2
-
3
-
4
-
5
-
6
-
7
-
8
-
9
-
10
-
11
-
12
-
13
-
14
-
15
-
16
-
17
-
18
-
19
-
20
-
21
-
22
-
23
-
24
-
25
-
26
-
27
-
28
-
29
-
30
-
31
-
32
-
33
-
34
-
35
-
36
-
37
-
38
-
39
-
40
-
41
-
42
-
43
-
44
-
45
-
46
-
47
-
48
-
49
-
50
-
51
-
52
-
53
-
54
-
55
-
56
-
57
-
58
-
59
-
60
-
61
-
62
-
63
-
64
-
65
-
66
-
67
-
68
-
69
-
70
-
 71
71 -
 72
72 -
 73
73 -
 74
74 -
 75
75 -
 76
76 -
 77
77 -
 78
78 -
 79
79 -
 80
80 -
 81
81 -
 82
82 -
 83
83 -
 84
84 -
 85
85 -
 86
86 -
 87
87 -
 88
88 -
 89
89 -
 90
90 -
 91
91 -
92
-
93
-
94
-
95
-
96
-
97
-
98
-
99
-
100
-
101
-
102
-
103
-
104
-
105
-
106
-
107
-
108
-
109
-
110
-
111
-
112
-
113
-
114
-
115
-
116
 |
 |

PITNEY BOWES INC.
NOTES TO CONSOLIDATED FINANCIAL STATEMENTS
(Tabular dollars in thousands, except per share amounts)
70
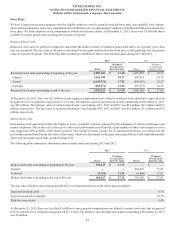
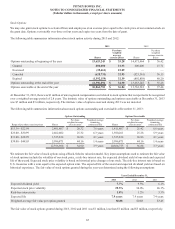
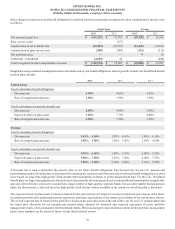
The following represents the results of cash flow hedging relationships for the years ended December 31, 2013 and 2012:
Year Ended December 31,
Derivative Gain (Loss)
Recognized in AOCI
(Effective Portion) Location of Gain (Loss)
(Effective Portion)
Gain (Loss) Reclassified
from AOCI to Earnings
(Effective Portion)
Derivative Instrument 2013 2012 2013 2012
Foreign exchange contracts $ 241 $(2,055) Revenue $(835)$ 1,298
Cost of sales 332 (185)
$(503)$ 1,113
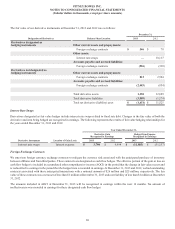
We also enter into foreign exchange contracts to minimize the impact of exchange rate fluctuations on short-term intercompany loans
and related interest that are denominated in a foreign currency. The revaluation of the intercompany loans and interest and the mark-to-
market adjustment on the derivatives are both recorded in earnings. The fair value of these contracts was a net liability of $2 million at
December 31, 2013 and a net asset of $2 million at December 31, 2012. All outstanding contracts at December 31, 2013 mature within
one year.
The following represents the results of our non-designated derivative instruments for the years ended December 31, 2013 and 2012:
Year Ended December 31,
Derivative Gain (Loss)
Recognized in Earnings
Derivatives Instrument Location of Derivative Gain (Loss) 2013 2012
Foreign exchange contracts Selling, general and administrative expense $(16,574)$ (4,254)
Credit-Risk-Related Contingent Features
Certain derivative instruments contain credit-risk-related contingent features that would require us to post collateral based on a combination
of our long-term senior unsecured debt ratings and the net fair value of our derivatives. At December 31, 2013, the maximum amount
of collateral that we would have been required to post had the credit-risk-related contingent features been triggered was $2 million.
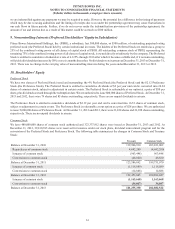
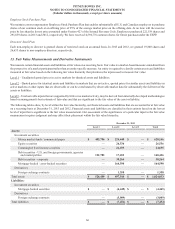
Fair Value of Financial Instruments
Our financial instruments include cash and cash equivalents, investment securities, accounts receivable, loan receivables, derivative
instruments, accounts payable and debt. The carrying value for cash and cash equivalents, accounts receivable, loans receivable, and
accounts payable approximate fair value because of the short maturity of these instruments.
The fair value of our debt is estimated based on recently executed transactions and market price quotations. The inputs used to determine
the fair value of our debt were classified as Level 2 in the fair value hierarchy. The carrying value and estimated fair value of our debt
at December 31, 2013 and 2012 was as follows:
December 31,
2013 2012
Carrying value $ 3,346,295 $ 4,017,375
Fair value $ 3,539,022 $ 4,200,970