Pitney Bowes 2013 Annual Report Download - page 82
Download and view the complete annual report
Please find page 82 of the 2013 Pitney Bowes annual report below. You can navigate through the pages in the report by either clicking on the pages listed below, or by using the keyword search tool below to find specific information within the annual report.-
 1
1 -
2
-
3
-
4
-
5
-
6
-
7
-
8
-
9
-
10
-
11
-
12
-
13
-
14
-
15
-
16
-
17
-
18
-
19
-
20
-
21
-
22
-
23
-
24
-
25
-
26
-
27
-
28
-
29
-
30
-
31
-
32
-
33
-
34
-
35
-
36
-
37
-
38
-
39
-
40
-
41
-
42
-
43
-
44
-
45
-
46
-
47
-
48
-
49
-
50
-
51
-
52
-
53
-
54
-
55
-
56
-
57
-
58
-
59
-
60
-
61
-
62
-
63
-
64
-
65
-
66
-
67
-
68
-
69
-
70
-
71
-
 72
72 -
 73
73 -
 74
74 -
 75
75 -
 76
76 -
 77
77 -
 78
78 -
 79
79 -
 80
80 -
 81
81 -
 82
82 -
 83
83 -
 84
84 -
 85
85 -
 86
86 -
 87
87 -
 88
88 -
 89
89 -
 90
90 -
 91
91 -
 92
92 -
93
-
94
-
95
-
96
-
97
-
98
-
99
-
100
-
101
-
102
-
103
-
104
-
105
-
106
-
107
-
108
-
109
-
110
-
111
-
112
-
113
-
114
-
115
-
116
 |
 |
PITNEY BOWES INC.
NOTES TO CONSOLIDATED FINANCIAL STATEMENTS
(Tabular dollars in thousands, except per share amounts)
71
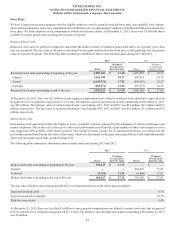
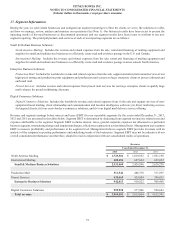
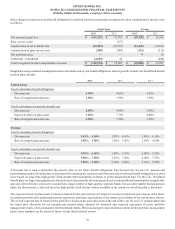
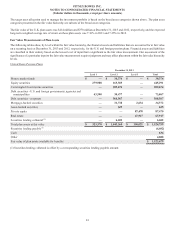
14. Restructuring Charges and Asset Impairments
The table below shows the activity in our restructuring reserves for the years ended December 31, 2013, 2012 and 2011 and includes
amounts for both continuing operations and discontinued operations.
Severance and
benefits costs
Pension and
Retiree
Medical
Asset
impairments
Other exit
costs Total
Balance at December 31, 2010 $ 101,639 $ — $ — $ 11,561 $ 113,200
Expenses, net 101,043 8,178 13,528 12,471 135,220
Gain on sale of facility — — (601) — (601)
Cash payments (97,646) — 601 (9,957) (107,002)
Non-cash charges — (8,178)(13,528) — (21,706)
Balance at December 31, 2011 105,036 — — 14,075 119,111
Expenses, net 24,992 — — (1,627) 23,365
Cash payments (67,488) — — (7,230) (74,718)
Balance at December 31, 2012 62,540 — — 5,218 67,758
Expenses, net 48,373 1,964 71 9,961 60,369
Cash payments (52,355) — — (7,165) (59,520)
Non-cash charges —(1,964)(71) — (2,035)
Balance at December 31, 2013 $ 58,558 $ — $ — $ 8,014 $ 66,572
In 2013, we initiated actions designed to further enhance our responsiveness to changing market conditions, streamline our business
operations, reduce our cost structure and create long-term flexibility to invest in growth. These actions resulted in restructuring charges
of $67 million. Restructuring charges also include the reversal of $7 million based on a review of our remaining obligations under prior
programs. The majority of the remaining restructuring reserves are expected to be paid over the next 12-24 months. Due to certain
international labor laws and long-term lease agreements, some payments will extend beyond 24 months. We expect to fund these payments
from cash flows from operations.
During 2012, we took actions to further streamline our business operations and reduce our cost structure. These actions consisted primarily
of workforce reductions and resulted in a pre-tax restructuring charge of $38 million. Restructuring charges are net of reversals of $15
million for changes in estimated reserves for prior period programs.
Restructuring charges in 2011 represent charges taken in connection with a series of strategic transformation initiatives announced in
2009. These initiatives were designed to transform and enhance the way we operate as a global company, enhance our responsiveness to
changing market conditions and create improved processes and systems and were implemented over a three year period through 2011.
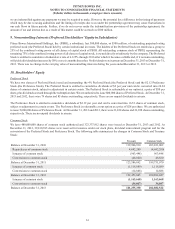
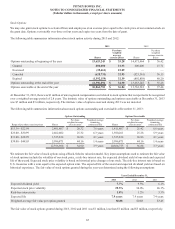
Asset Impairments
During 2013, we recorded a non-cash impairment charge of $26 million related to an agreement to sell our corporate headquarters building
(see Note 3).