Pitney Bowes 2013 Annual Report Download - page 89
Download and view the complete annual report
Please find page 89 of the 2013 Pitney Bowes annual report below. You can navigate through the pages in the report by either clicking on the pages listed below, or by using the keyword search tool below to find specific information within the annual report.-
 1
1 -
2
-
3
-
4
-
5
-
6
-
7
-
8
-
9
-
10
-
11
-
12
-
13
-
14
-
15
-
16
-
17
-
18
-
19
-
20
-
21
-
22
-
23
-
24
-
25
-
26
-
27
-
28
-
29
-
30
-
31
-
32
-
33
-
34
-
35
-
36
-
37
-
38
-
39
-
40
-
41
-
42
-
43
-
44
-
45
-
46
-
47
-
48
-
49
-
50
-
51
-
52
-
53
-
54
-
55
-
56
-
57
-
58
-
59
-
60
-
61
-
62
-
63
-
64
-
65
-
66
-
67
-
68
-
69
-
70
-
71
-
72
-
73
-
74
-
75
-
76
-
77
-
78
-
 79
79 -
 80
80 -
 81
81 -
 82
82 -
 83
83 -
 84
84 -
 85
85 -
 86
86 -
 87
87 -
 88
88 -
 89
89 -
 90
90 -
 91
91 -
 92
92 -
 93
93 -
 94
94 -
 95
95 -
 96
96 -
 97
97 -
 98
98 -
 99
99 -
100
-
101
-
102
-
103
-
104
-
105
-
106
-
107
-
108
-
109
-
110
-
111
-
112
-
113
-
114
-
115
-
116
 |
 |

PITNEY BOWES INC.
NOTES TO CONSOLIDATED FINANCIAL STATEMENTS
(Tabular dollars in thousands, except per share amounts)
78
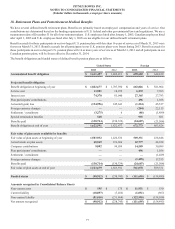
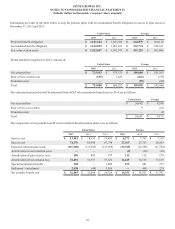
Information provided in the table below is only for pension plans with an accumulated benefit obligation in excess of plan assets at
December 31, 2013 and 2012:
United States Foreign
2013 2012 2013 2012
Projected benefit obligation $ 1,621,164 $ 1,821,300 $ 544,875 $ 660,110
Accumulated benefit obligation $ 1,610,029 $ 1,801,433 $ 532,774 $ 645,361
Fair value of plan assets $ 1,522,057 $ 1,582,379 $ 421,229 $ 505,084
Pretax amounts recognized in AOCI consists of:
United States Foreign
2013 2012 2013 2012
Net actuarial loss $ 733,943 $ 879,323 $ 200,000 $ 243,765
Prior service (credit) cost (135)1,229 (863)(751)
Transition asset ——(59)(68)
Total $ 733,808 $ 880,552 $ 199,078 $ 242,946
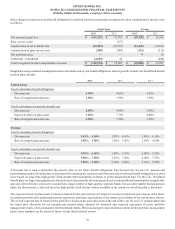
The estimated amounts that will be amortized from AOCI into net periodic benefit cost in 2014 are as follows:
United States Foreign
Net actuarial loss $ 24,642 $ 8,249
Prior service cost (credit) 9 (61)
Transition asset —(9)
Total $ 24,651 $ 8,179
The components of net periodic benefit cost for defined benefit pension plans were as follows:
United States Foreign
2013 2012 2011 2013 2012 2011
Service cost $ 13,981 $ 18,939 $ 19,450 $ 6,272 $ 7,763 $ 7,310
Interest cost 74,370 81,040 87,738 27,365 27,793 28,329
Expected return on plan assets (107,608) (121,623)(123,058)(34,769)(32,299) (31,784)
Amortization of net transition asset ——— (9)(10) (10)
Amortization of prior service cost 380 803 147 112 112 170
Amortization of net actuarial loss 32,494 52,957 37,522 14,445 14,103 11,135
Special termination benefits 548 — 1,489 935 601 277
Settlement / curtailment 2,638 (48) 3,036 —444 274
Net periodic benefit cost $ 16,803 $ 32,068 $ 26,324 $ 14,351 $ 18,507 $ 15,701