Pitney Bowes 2013 Annual Report Download - page 79
Download and view the complete annual report
Please find page 79 of the 2013 Pitney Bowes annual report below. You can navigate through the pages in the report by either clicking on the pages listed below, or by using the keyword search tool below to find specific information within the annual report.-
 1
1 -
2
-
3
-
4
-
5
-
6
-
7
-
8
-
9
-
10
-
11
-
12
-
13
-
14
-
15
-
16
-
17
-
18
-
19
-
20
-
21
-
22
-
23
-
24
-
25
-
26
-
27
-
28
-
29
-
30
-
31
-
32
-
33
-
34
-
35
-
36
-
37
-
38
-
39
-
40
-
41
-
42
-
43
-
44
-
45
-
46
-
47
-
48
-
49
-
50
-
51
-
52
-
53
-
54
-
55
-
56
-
57
-
58
-
59
-
60
-
61
-
62
-
63
-
64
-
65
-
66
-
67
-
68
-
 69
69 -
 70
70 -
 71
71 -
 72
72 -
 73
73 -
 74
74 -
 75
75 -
 76
76 -
 77
77 -
 78
78 -
 79
79 -
 80
80 -
 81
81 -
 82
82 -
 83
83 -
 84
84 -
 85
85 -
 86
86 -
 87
87 -
 88
88 -
 89
89 -
90
-
91
-
92
-
93
-
94
-
95
-
96
-
97
-
98
-
99
-
100
-
101
-
102
-
103
-
104
-
105
-
106
-
107
-
108
-
109
-
110
-
111
-
112
-
113
-
114
-
115
-
116
 |
 |

PITNEY BOWES INC.
NOTES TO CONSOLIDATED FINANCIAL STATEMENTS
(Tabular dollars in thousands, except per share amounts)
68
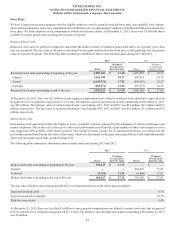
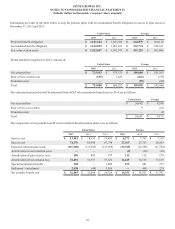
Available-For-Sale Securities
At December 31, 2013 and 2012, available-for-sale securities consisted of the following:
December 31, 2013
Amortized cost
Gross
unrealized
gains
Gross
unrealized
losses
Estimated fair
value
U.S. and foreign governments, agencies and municipalities 121,803 999 (3,372) 119,430
Corporate 37,901 935 (572) 38,264
Mortgage-backed / asset-backed securities 165,664 1,570 (2,636) 164,598
Total $ 325,368 $ 3,504 $ (6,580) $ 322,292
December 31, 2012
Amortized cost
Gross unrealized
gains
Gross unrealized
losses
Estimated fair
value
U.S. and foreign governments, agencies and municipalities 127,807 3,972 (56) 131,723
Corporate 41,095 2,851 (20) 43,926
Mortgage-backed / asset-backed securities 162,180 3,340 (3,145) 162,375
Total $ 331,082 $ 10,163 $ (3,221) $ 338,024
Gross unrealized losses on investment securities that were in a loss position for greater than 12 months were $1 million at December 31,
2013 and less than $1 million at December 31, 2012. We have not recognized an other-than-temporary impairment on any of the investment
securities in an unrealized loss position because we do not intend to sell these securities, it is more likely than not that we will not be
required to sell these securities before recovery of the unrealized losses and we expect to receive the contractual principal and interest
on these investment securities.
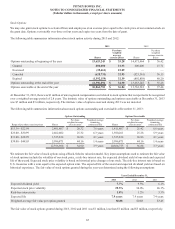
At December 31, 2013, the amortized cost and estimated fair value of available-for-sale securities have scheduled maturities as follows:
Amortized cost
Estimated fair
value
Within 1 year $ 41,853 $ 41,932
After 1 year through 5 years 46,869 47,284
After 5 years through 10 years 67,160 66,140
After 10 years 169,486 166,936
Total $ 325,368 $ 322,292
The expected payments on mortgage-backed and asset-backed securities may not coincide with their contractual maturities as borrowers
have the right to prepay obligations with or without prepayment penalties.
We have not experienced any write-offs in our investment portfolio. The majority of our mortgage-backed securities are either guaranteed
or supported by the U.S. government. We have no investments in inactive markets that would warrant a possible change in our pricing
methods or classification within the fair value hierarchy. Further, we have no investments in auction rate securities.
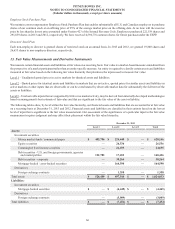
Derivative Instruments
The valuation of foreign exchange derivatives is based on a market approach using observable market inputs, such as forward rates. The
valuation of interest rate swaps is based on an income approach using a model with inputs that are observable or that can be derived from
or corroborated by observable market data. As required by the fair value measurements guidance, we also incorporate counterparty credit
risk and our credit risk into the fair value measurement of our derivative assets and liabilities, respectively. We derive credit risk from
observable data related to credit default swaps.
$ $ $ $
$ $ $ $