Pitney Bowes 2013 Annual Report Download - page 102
Download and view the complete annual report
Please find page 102 of the 2013 Pitney Bowes annual report below. You can navigate through the pages in the report by either clicking on the pages listed below, or by using the keyword search tool below to find specific information within the annual report.-
 1
1 -
2
-
3
-
4
-
5
-
6
-
7
-
8
-
9
-
10
-
11
-
12
-
13
-
14
-
15
-
16
-
17
-
18
-
19
-
20
-
21
-
22
-
23
-
24
-
25
-
26
-
27
-
28
-
29
-
30
-
31
-
32
-
33
-
34
-
35
-
36
-
37
-
38
-
39
-
40
-
41
-
42
-
43
-
44
-
45
-
46
-
47
-
48
-
49
-
50
-
51
-
52
-
53
-
54
-
55
-
56
-
57
-
58
-
59
-
60
-
61
-
62
-
63
-
64
-
65
-
66
-
67
-
68
-
69
-
70
-
71
-
72
-
73
-
74
-
75
-
76
-
77
-
78
-
79
-
80
-
81
-
82
-
83
-
84
-
85
-
86
-
87
-
88
-
89
-
90
-
91
-
 92
92 -
 93
93 -
 94
94 -
 95
95 -
 96
96 -
 97
97 -
 98
98 -
 99
99 -
 100
100 -
 101
101 -
 102
102 -
 103
103 -
 104
104 -
 105
105 -
 106
106 -
 107
107 -
 108
108 -
 109
109 -
 110
110 -
 111
111 -
 112
112 -
113
-
114
-
115
-
116
 |
 |

PITNEY BOWES INC.
NOTES TO CONSOLIDATED FINANCIAL STATEMENTS
(Tabular dollars in thousands, except per share amounts)
91
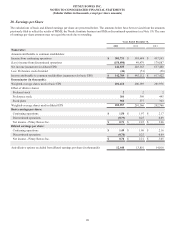
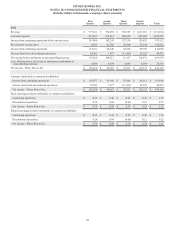
21. Quarterly Financial Data (unaudited)
The following table sets forth selected unaudited quarterly data for the years ended December 31, 2013 and 2012. The amounts in the
tables below have been revised from the amounts previously filed to reflect the results of PBMS, the Nordic furniture business and IMS
as discontinued operations (see Note 19). The sum of the quarterly earnings per share amounts may not equal the quarterly total or annual
amount due to rounding.
First
Quarter
Second
Quarter
Third
Quarter
Fourth
Quarter Total
2013
Revenue $ 929,012 $ 970,416 $ 938,786 $ 1,031,187 $ 3,869,401
Cost and expenses 843,475 857,167 846,145 919,437 3,466,224
Income from continuing operations before income taxes 85,537 113,249 92,641 111,750 403,177
Provision for income taxes 18,769 25,391 11,370 27,539 83,069
Income from continuing operations 66,768 87,858 81,271 84,211 320,108
Income (loss) from discontinued operations 5,332 (92,497) (82,204) 10,471 (158,898)
Net income (loss) before attribution of noncontrolling interests 72,100 (4,639) (933) 94,682 161,210
Less: Preferred stock dividends of subsidiaries attributable to
noncontrolling interests 4,594 4,594 4,594 4,593 18,375
Net income (loss) - Pitney Bowes Inc. $ 67,506 $ (9,233) $ (5,527) $ 90,089 $ 142,835
Amounts attributable to common stockholders:
Income from continuing operations $ 62,174 $ 83,264 $ 76,677 $ 79,618 $ 301,733
Income (loss) from discontinued operations 5,332 (92,497) (82,204) 10,471 (158,898)
Net income - Pitney Bowes Inc. $ 67,506 $ (9,233) $ (5,527) $ 90,089 $ 142,835
Basic earnings per share attributable to common stockholders:
Continuing operations $ 0.31 $ 0.41 $ 0.38 $ 0.39 $ 1.50
Discontinued operations 0.03 (0.46) (0.41) 0.05 (0.79)
Net income (loss) - Pitney Bowes Inc. $ 0.34 $ (0.05) $ (0.03) $ 0.45 $ 0.71
Diluted earnings per share attributable to common stockholders:
Continuing operations $ 0.31 $ 0.41 $ 0.38 $ 0.39 $ 1.49
Discontinued operations 0.03 (0.46) (0.40) 0.05 (0.78)
Net income (loss) - Pitney Bowes Inc. $ 0.33 $ (0.05) $ (0.03) $ 0.44 $ 0.70